How to Calculate Customer Lifetime Value for SaaS Growth
At its core, calculating customer lifetime value is about figuring out how much revenue a single customer is likely to bring in over their entire time with your business. For a quick, back-of-the-napkin calculation, you can use a simple formula: CLV = Average Purchase Value × Average Purchase Frequency × Average Customer Lifespan. This gives you a solid starting point for understanding what a customer is really worth.
Why Customer Lifetime Value Is a SaaS Founder's North Star

Before we get bogged down in formulas, let's talk about why customer lifetime value (CLV) is so much more than just another number on your dashboard. For any SaaS founder, CLV is your compass. It guides every critical decision you make—from marketing spend to your product roadmap—and keeps your business pointed toward long-term, sustainable growth.
Without a firm grip on your CLV, you're essentially flying blind. It's easy to celebrate a low Customer Acquisition Cost (CAC), but that celebration is short-lived if those new users churn after just two months. On the flip side, you might shy away from a marketing channel that seems expensive upfront, even though it consistently delivers loyal customers who stick around for years.
The Strategic Power of CLV
Knowing how to calculate and interpret CLV shifts your entire mindset from being reactive to truly strategic. It gives you the confidence, backed by data, to make smarter choices that actually move the needle. Think of it as the vital link between what you spend to get a customer and what you do to keep them.
This one metric helps you nail down the answers to some of the biggest questions in your business:
- How much can we actually afford to spend on acquiring a customer? Your CLV dictates the ceiling for your CAC. Spend more, and you're losing money.
- Who are our most valuable customers? Segmenting CLV by customer type or acquisition channel helps you pinpoint your ideal customer profile so you can find more of them.
- Are our customer success efforts paying off? A rising CLV is proof that your investments in retention and customer satisfaction are delivering a real financial return.
For instance, a SaaS business might find that customers coming from an affiliate program have a 30% higher CLV than those acquired through paid ads. That insight is a green light to pour more resources into the affiliate network, even if the initial cost per lead feels a bit higher.
Understanding CLV is the difference between building a business that just gets by and one that truly thrives. It forces you to look beyond short-term wins and focus on building profitable, long-lasting relationships.
Ultimately, your CLV is a direct reflection of the health of your business model. It tells you whether you're building a loyal community or just pouring water into a leaky bucket. Getting this right is the foundation for scalable, predictable revenue.
The Essential Formulas For Calculating CLV

Alright, let's get into the numbers. The math behind customer lifetime value can seem intimidating, but for most SaaS founders, it really boils down to two core models. You can either look backward at what’s already happened (Historic CLV) or look forward to what you expect will happen (Predictive CLV).
Which one should you use? It really depends on where you are with your business. If you're just starting out, the historic model gives you a quick, tangible baseline. But if you’ve been around for a while and have some solid data, the predictive model is where the real strategic insights live.
The Simple Historic CLV Formula
The historic model is the most straightforward way to get a handle on CLV. It’s all about using past data to figure out how much revenue your average customer has already brought in. Think of it as a quick snapshot of customer worth, without any complex forecasting involved.
The classic formula you’ll see everywhere is: CLV = (Average Purchase Value × Purchase Frequency) × Customer Lifespan. This one has been a go-to for years, especially in e-commerce. For a SaaS business, you might have a customer paying $50/month (renewing 12 times a year) who typically stays for 24 months. Their historic CLV would be a neat $1,200. You can find more on this traditional approach in these insights on customer lifetime value analysis.
Key Takeaway: Historic CLV is a valuable rearview mirror. It tells you the proven value of your customers based on actual behavior, making it a reliable but limited metric.
This formula works particularly well for businesses with consistent, recurring transactions. For SaaS companies, that means having a good grip on your billing cycles. Automating this process helps tremendously, and you can learn more about how to set up recurring payments to keep your data clean and consistent.
The Powerful Predictive CLV Formula
While looking back is useful, looking forward is where the real power lies for a growing SaaS company. The predictive model forecasts the total revenue you can expect from a customer over their entire future relationship with your business. It's not about what they've spent, but what they will spend.
This approach is definitely more complex, but the payoff is a far more accurate picture that can guide your marketing spend and customer acquisition strategy. For most SaaS businesses, this is the formula to master:
CLV = (Average Revenue Per User (ARPU) x Gross Margin %) / User Churn Rate
Let’s break down what each of those pieces means:
- Average Revenue Per User (ARPU): This is your average revenue from a single customer over a set period, usually a month or a year. Just take your total revenue for that period and divide it by your number of active customers.
- Gross Margin %: Revenue is one thing, but profit is another. This metric accounts for the direct costs of serving your customers, like hosting or dedicated support. The math is (Total Revenue - Cost of Goods Sold) / Total Revenue.
- User Churn Rate: This is the percentage of customers who cancel their subscription in a given period. The lower your churn, the longer your customers stick around, which directly boosts your CLV.
So, let's put it into practice. Imagine your B2B SaaS has an ARPU of $150/month, a healthy gross margin of 80%, and a monthly churn rate of 4%.
Here’s the calculation: ($150 * 0.80) / 0.04 = $3,000
This tells you that, on average, you can expect to generate $3,000 in gross profit from each customer over their entire lifecycle. Now that's a number you can use to decide if spending $300 to acquire a new customer is a good deal.
Historic vs Predictive CLV Formulas Compared
Choosing between a historic and predictive model isn't just about the math; it's about your strategic goals. Here’s a quick comparison to help you decide which approach fits your SaaS business right now.
| Method | Formula | Best For | Key Limitation |
|---|---|---|---|
| Historic CLV | (Avg. Purchase Value × Purchase Freq.) × Customer Lifespan | Startups needing a quick, simple baseline. Businesses with very stable, predictable customer behavior. | Purely backward-looking. It can't account for changes in customer behavior or market dynamics. |
| Predictive CLV | (ARPU x Gross Margin %) / User Churn Rate | Established SaaS companies making strategic decisions on marketing spend, customer acquisition, and retention. | Requires more reliable data (especially churn rate) and can be less accurate for very new businesses with a short history. |
Ultimately, many seasoned companies use both. The historic model provides a solid, reality-checked foundation, while the predictive model offers the forward-looking insight needed to scale intelligently.
Gathering the Right Data for Accurate Calculations
Any formula is only as good as the numbers you plug into it. To get a customer lifetime value that's actually useful, you need clean, reliable data. The old saying "garbage in, garbage out" is brutally true here, so let's walk through where to find the essential metrics in the tools you're probably already using.
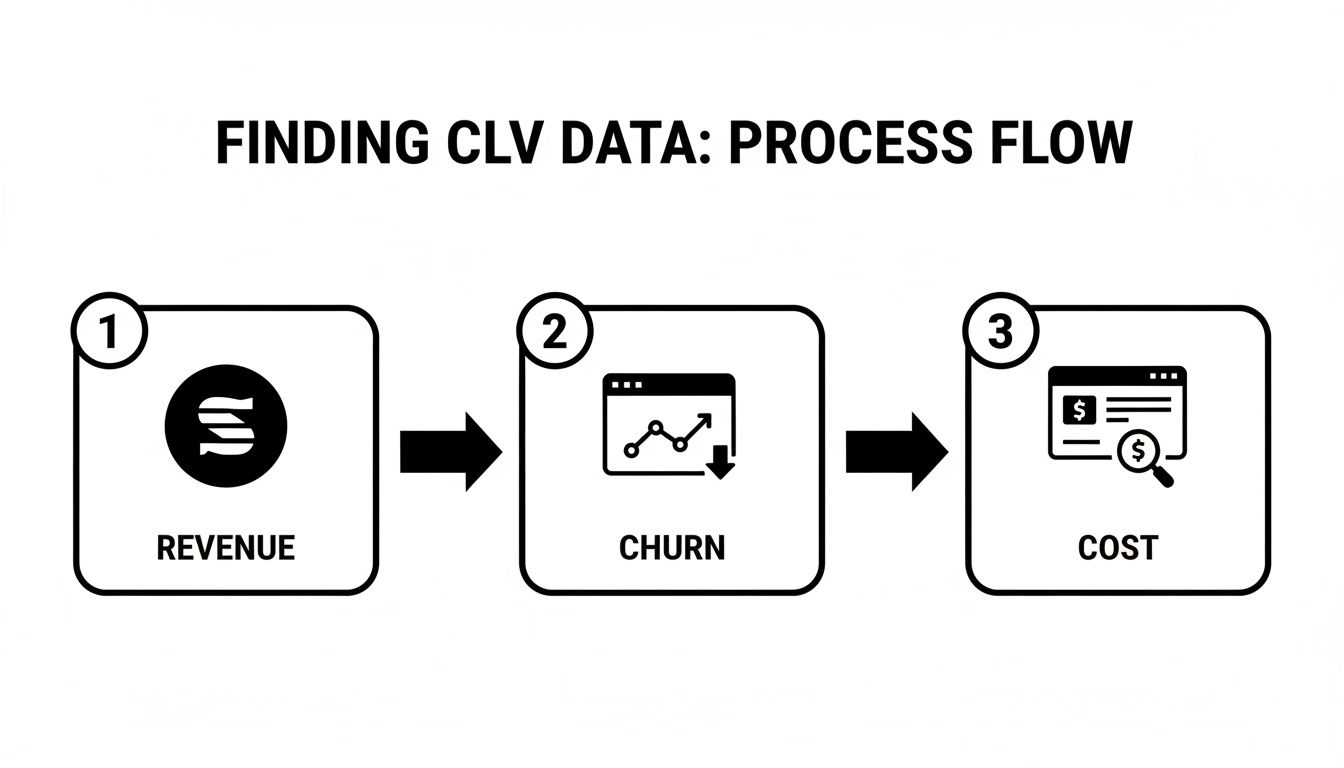
Think of it as a data scavenger hunt. You're looking for three main puzzle pieces: revenue per user, customer churn, and acquisition cost. These aren't just vanity metrics; they're the absolute foundation for a meaningful CLV.
Finding Your Key Revenue Metrics
The best place to start is almost always your payment processor or subscription management platform. This is where the money actually comes in, so it’s your source of truth for all things revenue.
Let's start with Average Revenue Per User (ARPU). If you're using a tool like Stripe, you can find this right in your analytics dashboard. It's usually straightforward to filter by a specific date range to get your monthly or annual ARPU.
- Quick Tip: Make sure you exclude one-off payments like setup or implementation fees when calculating ARPU for a subscription business. You're trying to measure the predictable, ongoing revenue stream, not the one-time bumps.
Your Gross Margin is the next critical piece. To figure this out, you’ll need to subtract your Cost of Goods Sold (COGS) from your total revenue. For a SaaS company, COGS typically includes direct costs like server hosting, third-party API fees, and the salaries of your dedicated customer support team.
Pinpointing Churn and Acquisition Costs
Next up, you have to get a handle on how quickly you’re losing customers. Your Customer Churn Rate is a vital health metric that has a massive impact on CLV. You can usually find this in your subscription management tool, which tracks customer cancellations and failed payments over time.
A common mistake is focusing only on revenue churn. For the predictive CLV formula, you really need to be looking at logo churn—the percentage of actual customers who cancel their subscriptions.
Finally, you need to know exactly what it costs to get a new customer through the door. Your Customer Acquisition Cost (CAC) is calculated by adding up all your sales and marketing expenses in a period and dividing that by the number of new customers you signed up. To get this number, you'll need to pull your total ad spend from platforms like Google Ads or Meta Business Suite. Don't forget to factor in the salaries for your marketing team and the cost of any software they use.
The Importance of Data Segmentation
Calculating a single, blended CLV for your entire customer base is a decent starting point, but the real magic happens when you start segmenting. Your data becomes incredibly powerful once you slice it into different cohorts, which helps you answer much more strategic questions.
For example, you could segment your customers in a few different ways:
- By Acquisition Channel: How does the CLV of a customer from organic search compare to one from your affiliate program? You might discover that affiliates bring in customers who stick around longer and have a 25% higher CLV.
- By Subscription Plan: What's the CLV for users on your "Basic" tier versus your "Pro" tier? This kind of analysis is crucial for validating your pricing strategy and spotting key upsell opportunities.
Getting this level of detail often requires more than just your payment processor. To make sure you're pulling all the data you need for accurate, nuanced CLV calculations, it's worth looking into tools for robust analytics and multi-channel attribution. These platforms tie together data from all your different sources, giving you a single, unified view of the customer journey. Understanding CLV alongside other core customer success metrics will give you a much clearer picture of your company's overall health.
A Real-World Walkthrough: Calculating SaaS CLV From Scratch
The formulas are great, but let's be honest—they don't mean much until you see them in action. So, let’s walk through exactly how a fictional (but realistic) SaaS company called ‘SyncUp’ would calculate its customer lifetime value. Putting some real numbers to the theory makes the whole thing click.
Before they even touch a calculator, the team at SyncUp needs to pull data from a few different places. This isn't a one-stop-shop metric; it requires combining financial data, user behavior stats, and marketing costs to get the full picture.
As you can see, they’ll need to grab revenue numbers from their payment processor like Stripe, churn rates from their product analytics platform, and acquisition costs from their ad networks.
SyncUp's First Pass: A Predictive CLV Calculation
The SyncUp team starts with the predictive CLV formula. It’s their go-to because it gives them a forward-looking estimate that’s invaluable for planning and budgeting.
The formula they’re using is: CLV = (ARPU x Gross Margin %) / User Churn Rate
First things first, they need the raw ingredients. After digging into their various dashboards, they assemble the key data points for a simple, company-wide CLV:
- Average Revenue Per User (ARPU): A quick look at their Stripe data shows the average customer pays $75 per month.
- Gross Margin: The finance team crunched the numbers. After accounting for direct costs like hosting, third-party APIs, and customer support salaries, their gross margin sits at a healthy 85%.
- Monthly User Churn Rate: Their analytics tool confirms they lose about 3% of their customers each month.
With these figures in hand, it's just a matter of plugging them into the formula.
($75 ARPU * 0.85 Gross Margin) / 0.03 Churn Rate = $2,125
The result? On average, SyncUp can expect to generate $2,125 in gross profit from each new customer over their entire time with the company. It's a fantastic baseline, but the real magic happens when you start layering in other metrics.
The All-Important CLV to CAC Ratio
Knowing your CLV is only half the story. The real test of a sustainable business is how that number stacks up against your Customer Acquisition Cost (CAC). SyncUp’s marketing lead pulls the reports and finds their blended CAC across all channels is $650.
Now they can calculate the all-important ratio:
CLV / CAC = $2,125 / $650 = 3.27
This gives them a CLV to CAC ratio of roughly 3.3:1. For a SaaS business, anything over 3:1 is typically considered the gold standard. SyncUp’s ratio confirms their growth engine is healthy—for every dollar they put into acquiring a customer, they’re getting more than three dollars back.
A strong CLV-to-CAC ratio is the ultimate proof of a healthy business model. It confirms that you aren't just acquiring customers, but profitable ones who fuel long-term growth.
Uncovering Deeper Insights with Segmentation
A single, blended CLV is useful, but it can also hide massive opportunities. The smartest teams know this. The SyncUp crew decides to dig deeper and segment their CLV by acquisition channel. Are all customers created equal?
They isolate their two biggest channels—paid search ads and their affiliate program. What they find is eye-opening.
| Metric | Paid Search Ads | Affiliate Program |
|---|---|---|
| ARPU | $70 per month | $85 per month |
| Monthly Churn Rate | 4% | 2% |
| Gross Margin | 85% (same) | 85% (same) |
| Calculated CLV | $1,487.50 | $3,612.50 |
The difference is staggering. Customers coming from the affiliate program have a CLV more than double that of customers from paid search. They pay more and stick around twice as long.
This single insight is a game-changer. It gives SyncUp clear, data-backed proof that they should be doubling down on their affiliate program. This is how you move from just calculating CLV to using it to make smarter, more profitable decisions.
Turning CLV Insights Into a Growth Flywheel
Calculating your customer lifetime value is a bit like finding a treasure map. The number itself is just the starting point—the real gold is in using that map to guide your growth strategy. Once you know who your most valuable customers are, you can stop guessing and start making smart decisions that build a powerful growth flywheel.
This all starts with taking a hard look at where your marketing dollars are actually going. It's so easy to fall into the trap of optimizing for the lowest possible Customer Acquisition Cost (CAC), but CLV shines a bright light on the flaw in that logic. A cheap lead who churns in two months is ultimately far more expensive than a pricier one who sticks around for years and becomes a vocal advocate for your brand.
Reallocating Your Marketing Budget
Your segmented CLV data is the key to unlocking this. Use it to pinpoint the channels that consistently deliver high-value customers. For example, if you find that customers from your affiliate program have a CLV that's double that of those from paid search, it’s a glaringly obvious signal to invest more in recruiting and empowering your affiliates.
This single insight can completely reshape your marketing approach:
- Channel Prioritization: You can confidently shift your budget from low-CLV channels to high-CLV sources, even if their initial CAC is a bit higher.
- Ad Creative: Start tailoring your messaging and ad creative to attract more people who look just like your best customers. Speak their language.
- Affiliate Commissions: A high CLV gives you the breathing room to offer more generous commission structures, which will attract top-tier partners who bring in truly amazing customers.
Don’t just chase cheap leads. Use CLV to find profitable customers. This shift in focus is the foundation for building a sustainable, scalable business model.
Using CLV to Guide Your Product Roadmap
CLV isn't just a marketing metric; it's a goldmine for your product team, too. Digging into the behavior of your highest-CLV customers can reveal exactly which features are driving retention.
Maybe you notice your most valuable users are all power users of a specific integration or a particular reporting tool. That’s a massive hint to double down on improving that functionality. It’s clearly what keeps them around.
This data helps you stop guessing and start prioritizing feature development based on real-world value. It ensures you’re building a product that not only attracts new users but also keeps them hooked for the long haul. To do this right, you need a clear picture of the entire user journey. Understanding customer experience journey mapping is essential for identifying the make-or-break touchpoints that create those loyal, high-value users.
By tying CLV directly to your product decisions, you create a fantastic virtuous cycle. Better, stickier features lead to higher retention, which in turn boosts your CLV even further. For a deeper dive into specific strategies, our guide on how to increase customer lifetime value offers more actionable tips.
Answering Your Top CLV Questions
Once you've got the hang of the basic CLV calculation, the real-world questions start to pop up. I often hear founders asking how often they should be running these numbers, what a “good” CLV actually looks like, and, most importantly, where to even begin when the results are disappointing.
Answering these questions is what turns CLV from a simple metric into a powerful strategic lever for your business.
How Often Should I Calculate CLV for My SaaS Business?
For most SaaS companies, a quarterly calculation is the perfect rhythm. This cadence is frequent enough to catch important trends and see the effects of your recent marketing or product changes, but it keeps you from getting bogged down in the day-to-day fluctuations.
That said, if your startup is in a major growth spurt, you're in the middle of a big marketing push, or you just rolled out a significant pricing change, you'll want more immediate feedback. In those cases, switching to a monthly CLV calculation can help you make faster, more informed decisions.
The benchmark for a healthy SaaS business is a CLV to CAC ratio of 3:1 or higher. This is your north star. It tells you that for every dollar you spend to get a new customer, you're making at least three dollars back over their lifetime.
What Is a Good CLV to CAC Ratio for a SaaS Startup?
While 3:1 is the gold standard for a sustainable business, the context matters. If you're seeing a 1:1 ratio, that’s a red flag. It essentially means you’re spending a dollar to make a dollar, which isn't a viable long-term model. It's time to hit the brakes and re-evaluate your strategy.
On the flip side, what if your ratio is 5:1 or even higher? While it sounds great, it might actually signal that you're being too conservative with your growth spending. A high ratio like that is a strong indicator that you have a fantastic product-market fit and can afford to invest more aggressively in acquiring new customers.
My CLV Is Low. Where Do I Start to Improve It?
If your CLV isn't where you want it to be, don't panic. The fix almost always comes down to focusing on two key drivers: increasing customer retention and boosting your average revenue per user (ARPU).
Here’s a practical game plan:
- Attack Churn First: Dive deep into your churn data. Are people leaving in the first month? After a specific feature update? Conduct exit surveys and talk to former customers to uncover the why behind the what. Fixing those core issues is your top priority.
- Find Expansion Opportunities: Look for ways to increase the value of your existing customer base. Can you upsell them to a higher-tier plan with more features? Are there valuable add-ons they would pay for? This is often the fastest path to a higher ARPU.
A fantastic, and often overlooked, place to begin is with your onboarding. A smooth, welcoming, and value-driven first experience has a massive ripple effect, dramatically improving both long-term retention and a customer's overall lifetime value.
Ready to grow your SaaS with high-value customers? Refgrow makes it easy to launch a native affiliate program that attracts loyal, long-term users. Get started in minutes and connect with our network of affiliates.