Mastering SaaS Customer Success Metrics

When we talk about customer success metrics, we're really talking about Key Performance Indicators (KPIs) that tell us how well our business is truly serving its customers. These aren't just vanity numbers; they get to the heart of building healthy, long-term relationships that last. They move way beyond simple satisfaction surveys to track everything from customer loyalty and retention to the direct financial impact a great customer experience can have on your bottom line.
Why Customer Success Metrics Are Your Growth Compass
Trying to run a SaaS company without clear customer success metrics is like trying to navigate a ship in a storm without a compass. You're essentially flying blind, guessing at your speed, direction, and whether you're about to hit an iceberg. It's a massive risk you just can't afford to take.
These metrics aren't just for customer success managers (CSMs) to glance at in a weekly report. They act as a strategic guide for the entire company. The insights they provide should inform your product roadmap, shape your marketing campaigns, and even refine your sales process. This is how you shift from putting out fires to proactively building a business driven by data.
Telling the Story Behind the Numbers
Every metric tells a small part of a much bigger story about your company's health. A high churn rate, for instance, isn't just a scary percentage. It's a clear signal that there's a disconnect between the value your product promises and what customers are actually experiencing. On the flip side, a strong Net Promoter Score (NPS) tells a story of happy customers who are evolving into genuine brand advocates.
When you move from a reactive support model to a proactive, data-driven strategy, you start building a truly sustainable business. It’s all about spotting problems before they become catastrophes and seizing opportunities before your competitors even know they exist.
This data-first mindset empowers every team to play a role in driving growth:
- Product Teams: Can look at feature adoption rates to see what's a hit and what's a miss. This real-world usage data is gold for prioritizing what to build next.
- Marketing Teams: Can analyze the traits of your best customers (those with a high Customer Lifetime Value) to sharpen their targeting and messaging.
- Sales Teams: Can use customer health scores to pinpoint happy users who are perfect candidates for an upsell or a glowing case study.
From Cost Center to Revenue Engine
Ultimately, tracking the right KPIs proves that customer success isn't a cost center—it's one of your most powerful revenue engines. When you can draw a straight line from your CS team's efforts to metrics like Customer Lifetime Value (LTV) and Net Revenue Retention (NRR), you're speaking the language of the C-suite.
Demonstrating that successful customers stay longer, spend more, and bring in new business makes it easy to justify further investment in the customer experience. For a comprehensive look at the indicators that matter most, these top customer success metrics to track and analyze offer an essential guide. Embracing this strategic view is no longer optional; it's how you thrive.
To give you a clearer picture, let's break down the most important metrics we'll be covering in this guide. Think of this table as your quick-reference cheat sheet for understanding the core pillars of customer success measurement.
Key Customer Success Metrics At a Glance
| Metric | Primary Purpose | What It Measures |
|---|---|---|
| Net Promoter Score (NPS) | Gauge customer loyalty | The likelihood of customers to recommend your product or service. |
| Churn Rate | Monitor customer attrition | The percentage of customers who cancel their subscriptions over a period. |
| Customer Lifetime Value (LTV) | Assess long-term customer value | The total revenue you can expect from a single customer account. |
| Customer Health Score | Predict future customer behavior | A consolidated score indicating the likelihood of a customer to grow, renew, or churn. |
| Net Revenue Retention (NRR) | Measure revenue from existing customers | The percentage of recurring revenue retained from existing customers, including upsells and downgrades. |
| Customer Satisfaction (CSAT) | Evaluate transactional happiness | Short-term happiness with a specific interaction, product, or service. |
| First Contact Resolution (FCR) | Assess support efficiency | The percentage of support inquiries resolved during the first interaction. |
Each of these metrics provides a unique lens through which to view your business, and together, they create a comprehensive picture of your company's health and its relationship with its customers.
Decoding The Customer Health Score
While metrics like NPS and churn tell you a story about the past, the Customer Health Score is your crystal ball for the future. Think of it as a living, breathing report card for each customer relationship, one that helps predict what they'll do next.
It’s not just one number. Instead, it’s a smart blend of different data points, all rolled into a single, easy-to-read rating (like red, yellow, or green). The goal is to answer one simple, crucial question: Is this customer getting value and likely to stick around?
By putting a number on customer health, you shift from just reacting to problems to proactively building stronger relationships. This makes it one of the most powerful customer success metrics you can track, giving you a leading indicator of who might churn, who will stay, and who is ready to grow.
What Goes into a Customer Health Score
A great health score isn’t a one-size-fits-all template. It has to be tailored to what “success” actually looks like for your specific product and your customers. The formula is a mix of different data categories, with each one weighted based on how much it really matters to a customer’s journey.
The whole idea is to combine various signals to get a complete, 360-degree view. This is what makes it so essential for evaluating customer success—it reflects how people really engage with your product and the value they're getting. Top companies are using this score to gauge satisfaction and predict retention with far more accuracy than old-school sales metrics ever could. You can dig deeper into how leading businesses use these KPIs by checking out this guide on the top customer success metrics on Bitrix24.com.
So, what are the common ingredients in this recipe?
- Product Usage Data: This is usually the big one. It covers things like how often a customer logs in, how many features they’ve actually adopted, and the total time they spend in the app.
- Support Ticket History: Is the customer constantly hitting roadblocks? A high number of tickets, especially ones that keep getting reopened, is often a sign of poor health.
- Survey Feedback: You have to include sentiment data like NPS and CSAT. A user who is active but just gave you a low NPS score is a huge red flag.
- Billing and Account Information: How long have they been with you? Are their payments always on time? This adds a layer of financial and relationship stability to the score.
By creating a holistic score, you avoid the trap of looking at a single metric in isolation. A customer who logs in daily but has a detractor NPS score is not as "healthy" as their usage alone might suggest.
Putting Health Scores into Action
Once you have a reliable health score system in place, you can start segmenting your customer base and tailoring your approach for each group. This lets your customer success team focus their precious time and energy where it will make the biggest difference.
This concept map shows how core customer success metrics influence each other, all driving toward long-term value.
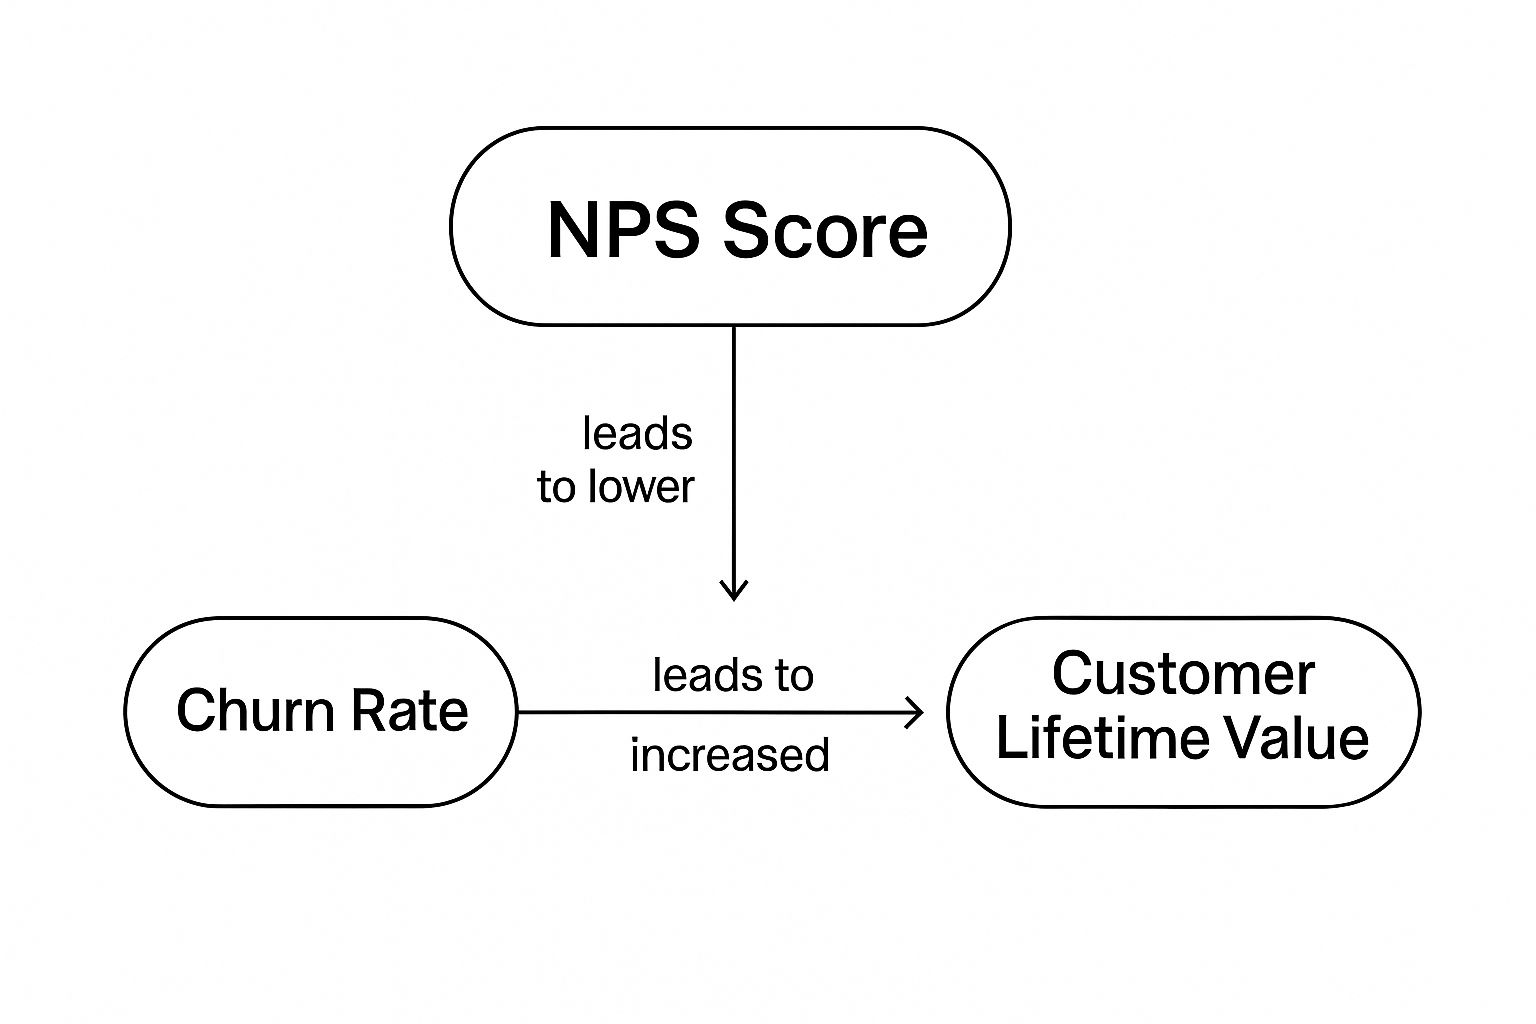
As the visual shows, a higher Net Promoter Score is directly linked to a lower Churn Rate, which ultimately builds a much greater Customer Lifetime Value. It's all connected.
Here’s a practical way to use the different health score segments:
Healthy Customers (Green): These are your champions and prime candidates for upsells or cross-sells. Get them involved in case studies, ask for testimonials, or invite them to beta test new features. The goal here isn't just to keep them happy, but to nurture and expand the partnership.
At-Risk Customers (Yellow): These accounts are flashing warning signs, like a recent dip in usage or a poor survey response. This score should trigger proactive outreach. A CSM can check in, offer some targeted training, or uncover the problem before it gets worse.
Unhealthy Customers (Red): These customers are waving bright red flags, signaling they are close to churning. They might have stopped using the product entirely, logged several critical support tickets, or hit you with a very low NPS score. This demands an immediate, high-touch intervention to figure out the root cause and see if a rescue plan is possible.
Mastering Retention and Churn: The Leaky Bucket Problem
Every SaaS business owner knows the thrill of landing a new customer. You're pouring water into a bucket, trying to fill it to the brim. But what happens if that bucket has holes? You'll be scrambling to pour water in, only to watch it leak out just as fast.
That leak is customer churn. It’s the silent growth killer, and learning to manage it is one of the most critical skills in customer success.

Think of retention and churn as two sides of the same coin. Retention is the percentage of customers who stick around, while churn is the percentage who say goodbye. A high churn rate is a blaring alarm bell—it signals a deep disconnect between the value you promised and the experience you're actually delivering.
Getting a handle on churn isn't just about counting lost accounts. It's about performing a health check on your entire business.
How to Calculate Customer Churn Rate
The most basic way to measure churn is to simply count how many customers cancel over a given period. This is your Customer Churn Rate, and it's a straightforward but powerful metric.
The formula is pretty simple:
Customer Churn Rate = (Number of Customers Lost in a Period / Number of Customers at the Start of the Period) x 100
Let's say you started the month with 500 customers but lost 10 by the end. Your churn rate for that month is 2%. A low number is great, but the trend is what really matters. Is that 2% creeping up to 2.5%, then 3%? A steadily rising rate means you've got a problem that needs immediate attention.
Why Revenue Churn Is Even More Important
Here’s where it gets interesting. Relying only on customer churn can be dangerously misleading. Imagine you lost just two customers last month. On the surface, that sounds fantastic. But what if one was a small business paying $49/month and the other was an enterprise client paying $4,900/month?
This is why you absolutely must track Revenue Churn. It measures the dollar value of the monthly recurring revenue (MRR) you've lost, giving you a crystal-clear view of the financial damage.
Here's the formula:
Revenue Churn Rate = (MRR Lost from Churned Customers in a Period / MRR at the Start of the Period) x 100
Let's go back to our example. If your MRR at the start of the month was $100,000, losing those two customers means you lost $4,949 in revenue. Suddenly, your Revenue Churn Rate is 4.9%—more than double your Customer Churn Rate! That tells a much scarier, and more accurate, story. Tracking both is non-negotiable.
Finding the Leaks in Your Business
A high churn rate is a symptom, not the disease. To cure it, you have to dig in and find the root cause. While the reasons customers leave can be complex, they usually fall into a few common buckets.
Some of the most common drivers of high churn include:
- A Confusing Onboarding Process: If customers don't "get" your product right away, they'll never see its value. They get frustrated, give up, and cancel.
- Failure to Show Value: Customers need to see a clear ROI. Is your product saving them time? Making them money? If the value isn't obvious and immediate, they won't stick around.
- Bad Product-Market Fit: Sometimes, you're simply attracting the wrong people. If your product doesn't solve their specific problems, they were destined to churn from day one.
- Poor Customer Service: Nothing sours a relationship faster than slow, unhelpful, or robotic support. A bad support experience can undo months of goodwill.
- Pricing Mismatches: Customers might feel the price is too steep for what they get, or a competitor might be offering a similar solution for less.
Fixing these leaks isn't just about damage control; it's about turning retention into a powerful engine for growth. To see how, you can check out our guide on how to increase customer retention for some actionable strategies. By plugging the holes in your bucket, you can finally make sure the customers you work so hard to win actually stay for the long haul.
Measuring What Customers Really Think
While usage data is great for showing you what customers do, it can't tell you what they think or feel. To get the full picture of your customer relationships, you have to look past behavior and start measuring sentiment directly. This is where qualitative customer success metrics shine, giving you a direct line to your customers' honest opinions.
Two of the most important metrics for this are the Net Promoter Score (NPS) and the Customer Satisfaction (CSAT) score. Both rely on surveys, but they answer very different questions. NPS is all about long-term loyalty and brand advocacy, while CSAT gives you a snapshot of a customer's happiness right after a specific interaction. When you use both, you get a much more complete and well-rounded view of how your customers are feeling.

Uncovering Brand Loyalty with Net Promoter Score
The Net Promoter Score hinges on one beautifully simple question: "On a scale of 0-10, how likely are you to recommend our product to a friend or colleague?" Don't let its simplicity fool you; the answer reveals a goldmine of information about brand loyalty and your potential for word-of-mouth growth.
Based on how they answer, customers fall into three camps:
- Promoters (Score 9-10): These are your champions. They're loyal, enthusiastic fans who will keep buying from you and, just as importantly, tell others to do the same.
- Passives (Score 7-8): These folks are satisfied, but that's about it. They aren't unhappy, but they aren't actively singing your praises, either. They're also susceptible to being wooed by a competitor's offer.
- Detractors (Score 0-6): These are your unhappy campers. Not only are they at a high risk of churning, but they can also damage your reputation through negative reviews and word-of-mouth.
The NPS score itself is calculated by subtracting the percentage of Detractors from the percentage of Promoters, giving you a final score that can range anywhere from -100 to +100.
NPS = % Promoters - % Detractors
But the real magic of NPS isn't just the score. It's the follow-up. Always ask an open-ended question like, "What's the main reason for your score?" This is where you'll find the specific, actionable feedback you need to actually improve your product and customer experience.
Gauging In-the-Moment Happiness with CSAT
While NPS plays the long game, the Customer Satisfaction (CSAT) score is wonderfully tactical. It measures a customer's happiness with a single, specific interaction, which makes it perfect for pinpointing moments of friction along their journey. You've definitely seen this before—it's the classic, "How would you rate your satisfaction with this support call?" survey.
CSAT is one of the most popular customer success metrics because it provides an immediate pulse check on satisfaction. Companies that consistently maintain CSAT scores above 80% often see significantly higher retention and can even achieve up to 25% more revenue growth than competitors with lower scores. This metric is best used right after a key moment, like resolving a support ticket or onboarding a new user.
Turning Feedback into Action by Closing the Loop
Here's the thing: collecting NPS and CSAT data is only half the job. The companies that truly win at customer success are the ones that "close the loop"—meaning they actually do something with the feedback they get. This simple practice turns a survey from a measurement tool into a powerful engine for improvement.
Here’s how to do it right:
- Acknowledge and Engage Detractors: The moment you get a low score, reach out. Don't wait. Listen to what went wrong, empathize with their frustration, and work to make it right. Not only can this turn an angry customer into a loyal one, but it also gives you invaluable insight into how to prevent the same problem from happening again.
- Empower Your Promoters: Your fans want to help you, so let them! Don't just send a thank-you note. Invite them to join a beta program, write a review, or participate in a case study. They are your most powerful marketing asset, so give them a megaphone.
By systematically closing the feedback loop, you prove to customers that you're listening and are genuinely committed to getting better. This proactive approach doesn't just boost satisfaction; it's also a critical strategy to reduce churn rate by fixing issues before they spiral.
Connecting Customer Success To Your Bottom Line
https://www.youtube.com/embed/DWgmd6NqrO0
For a long time, many businesses have mistakenly filed customer success under "cost center." It's often seen as just an insurance policy against losing customers. But that view misses the bigger picture entirely.
The truth is, your customer success team can be one of your most powerful revenue drivers. A handful of key financial metrics can prove this, drawing a clear, undeniable line from your team's day-to-day work straight to the company's bottom line.
When you start speaking the language of the finance department, you move beyond fuzzy health scores. You begin to quantify the real dollar impact of keeping your customers happy and helping them grow. It’s time to show exactly how a great customer experience fuels real, predictable growth.
From Relationships To Revenue
The first step is to get a handle on Customer Lifetime Value (LTV). Think of LTV as the total amount of revenue you can realistically expect to earn from a single customer over the entire time they do business with you. It’s the ultimate benchmark for a healthy customer relationship.
A high LTV is a fantastic sign. It shows you’re not just making one-off sales; you’re building lasting partnerships. When your LTV is significantly higher than what it costs you to acquire a customer (your CAC), you've got a sustainable business model on your hands.
Customer Lifetime Value = Average Revenue Per Account (ARPA) / Customer Churn Rate
If your LTV is trending upward, it’s one of the clearest signals that your customer success initiatives are working. It means customers are sticking around longer and, just as importantly, finding enough value to spend more over time. Let's dig into that second part.
Tracking Growth With Expansion MRR
Preventing churn is table stakes. World-class customer success teams also actively generate new revenue from the customers they already have. The metric that captures this is Expansion Monthly Recurring Revenue (MRR).
Expansion MRR tracks all the new, predictable revenue you've earned from your existing customer base in a given month. This isn't one-time stuff; it's recurring revenue that comes from:
- Upsells: A customer upgrades to a higher-tier plan.
- Cross-sells: A customer buys another product or an add-on feature.
- More Seats: A customer adds more users to their existing plan.
This is arguably the best kind of revenue. Why? Because you didn't have to spend a dime on marketing or sales to get it. It's a direct result of your CSMs understanding customer needs, demonstrating value, and showing them what's next.
The Ultimate Metric: Net Revenue Retention
If I had to pick just one financial metric for a CS team to own, it would be Net Revenue Retention (NRR). This is the holy grail for SaaS. It gives you a complete, holistic view of your existing customer base's health in a single, powerful percentage.
Here’s how it works: NRR starts with your recurring revenue, subtracts revenue you lost from cancellations and downgrades (contraction MRR), and then adds back all the revenue you gained from upsells and cross-sells (expansion MRR).
The formula looks a little complex, but the concept is simple:
NRR = [(Starting MRR + Expansion MRR - Contraction MRR - Churned MRR) / Starting MRR] x 100
What makes NRR so special? An NRR of 100% means your growth from existing customers perfectly offset any revenue you lost from churn. But when your NRR climbs above 100%, something incredible happens. Your business would actually continue to grow even if you stopped signing up new customers tomorrow.
An NRR over 100% is the ultimate proof that your product is sticky and your customers are succeeding. Their growth is literally outpacing your losses. This is the hallmark of a top-tier customer success program and a massive driver of your company's valuation. Results like these often stem from smart SaaS customer retention strategies that focus on delivering proactive value. It proves that customer success isn't just patching a leaky bucket—it's actively making the bucket bigger.
Building A Modern Customer Success Team

Knowing your customer success metrics is half the battle. The other half—and often the harder part—is building a team that can actually move those numbers in the right direction. A modern customer success team is a far cry from a glorified support department. They're a proactive, revenue-focused unit built to drive long-term customer value and, ultimately, company growth.
But getting this right is tough. One of the biggest roadblocks I see is a glaring lack of professional development. It's a bit shocking, but recent industry data shows that nearly 70% of customer success managers don't have formal training or enablement programs at their companies. That deficit makes it incredibly difficult to scale your efforts and get everyone aligned on what truly matters. You can dig into the details in the latest State of Customer Success report.
Defining Roles and Responsibilities
To get past these hurdles, you have to start with crystal-clear roles. A Customer Success Manager (CSM) isn't a firefighter who parachutes in when a crisis erupts. Their job is to be a strategic partner, actively guiding customers to hit their goals using your product.
This means their day-to-day work should tie directly to the key customer success metrics we've been talking about:
- Onboarding and Adoption: Getting new customers up and running smoothly so they experience that first "aha!" moment quickly.
- Proactive Health Monitoring: Keeping a close eye on health scores to step in and help at-risk accounts before they think about leaving.
- Value Realization: Running regular business reviews to connect the dots for customers and demonstrate the tangible ROI they're getting.
- Expansion Opportunities: Spotting the signals that show a customer is primed for an upgrade or ready to use more of your product.
A CSM's goal isn't just to "keep customers happy." It's to "make customers successful." Happiness is a byproduct of success—and success is something you can actually measure.
Creating A Customer-Centric Culture
A world-class customer success program isn't built in a silo. It takes a real, company-wide commitment to put the customer at the center of everything. The most successful SaaS companies I've seen are handing ownership of critical revenue metrics directly to their CS teams, treating them as essential contributors to the bottom line.
This simple shift changes everything. It elevates the team from a cost center to a growth engine.
Suddenly, your CSMs aren't just thinking about preventing churn. They become accountable for expansion revenue and Net Revenue Retention (NRR), proving their direct financial impact. When you give them clear processes, the right training, and the proper tools (like AI-powered platforms to help them scale), you create a program that doesn't just manage relationships—it actively grows them.
Your Customer Success Metrics Questions, Answered
Alright, we've covered the what and why of the most important metrics. But let's be honest—that's where the real-world questions usually start popping up. When you actually try to put a measurement strategy into play, things can get messy.
Think of this section as your field guide. I've gathered some of the most common questions I hear from teams just like yours and broken them down into straightforward, practical answers. Getting these fundamentals right is what separates a data-driven CS program from one that’s just spinning its wheels.
What’s the One Metric I Absolutely Have to Track?
If I had to pick just one, it would be Net Revenue Retention (NRR). Hands down, it's the most powerful metric for any SaaS business. Why? Because it’s not just one number; it’s a complete story. NRR beautifully rolls retention, churn, and expansion revenue into a single percentage that tells you how healthy your existing customer base really is.
An NRR over 100% is the gold standard. It means the new revenue from your existing customers—through upgrades and add-ons—is more than enough to cover the revenue you're losing from those who churn.
This single metric is proof that you’ve built something people truly value. It shows you can grow your business even if you don't sign a single new customer. That's a powerful statement, and it’s why investors and C-suites are obsessed with it.
How Often Should My Team Be Looking at These Numbers?
This is a great question, and the answer isn't "all the time." You'll burn out. The key is to match your review cadence to the metric's purpose. I always advise teams to think in terms of leading versus lagging indicators.
- Leading Indicators: These are your early warning signals—things like product engagement, feature adoption rates, or even the number of support tickets. You need to keep a close eye on these, checking them daily or weekly. They give you a chance to act before a problem gets out of hand.
- Lagging Indicators: These are your outcome-based metrics, like Customer Lifetime Value (LTV), churn rate, and NRR. They tell you the results of your past actions, so a monthly or quarterly review is perfect.
- Sentiment Metrics: For things like NPS and CSAT, you should be collecting feedback continuously after key moments (like onboarding or a support interaction). Then, take a step back and review the overall trends monthly to see the bigger picture.
I Want to Build a Customer Health Score. Where Do I Even Start?
It’s easy to get overwhelmed trying to build the "perfect" health score from day one. Don't. The secret is to start small and iterate. Think of it as creating a "minimum viable score."
First, brainstorm a few key actions a customer takes that scream "they're getting value." Don't overthink it—maybe it's how often they log in, whether they've adopted that one "sticky" feature, or how many team members they've invited.
Pick just three or four of these, assign a simple weight to each, and create your first basic score. Then, just start tracking it. See how well it actually predicts which customers renew and which ones churn. You'll learn more from a simple, real-world score than you ever will from a complex formula on a whiteboard. Refine it from there.
Ready to turn your happiest customers into your best marketing channel? Refgrow makes it simple to launch a native affiliate program directly inside your SaaS product with just one line of code. Stop wrestling with clunky external tools and start accelerating your growth today. Explore Refgrow's features and start your free trial.