How to Calculate Monthly Recurring Revenue The Right Way

To calculate your monthly recurring revenue, you're essentially adding up all the predictable revenue from your active subscriptions for a given month. This number, what we call MRR, is the lifeblood of any subscription business—it's the steady pulse that tells you about your company's financial health and where it's headed.
Understanding MRR Beyond Just a Number
Monthly Recurring Revenue is so much more than a figure you plug into a spreadsheet. Think of it as a vital sign for your entire company. It’s what investors zero in on, what founders use to decide on budgets for hiring and marketing, and ultimately, it’s the story of your relationship with your customers. Nailing this calculation is the first real step toward building a business that's both predictable and ready to scale.
But the real magic happens when you look at what makes up that single MRR number. A top-line figure doesn't tell you the whole story. For example, is your growth coming from landing new customers, or are your existing ones upgrading and spending more? Are you churning through customers just as fast as you’re signing them up?
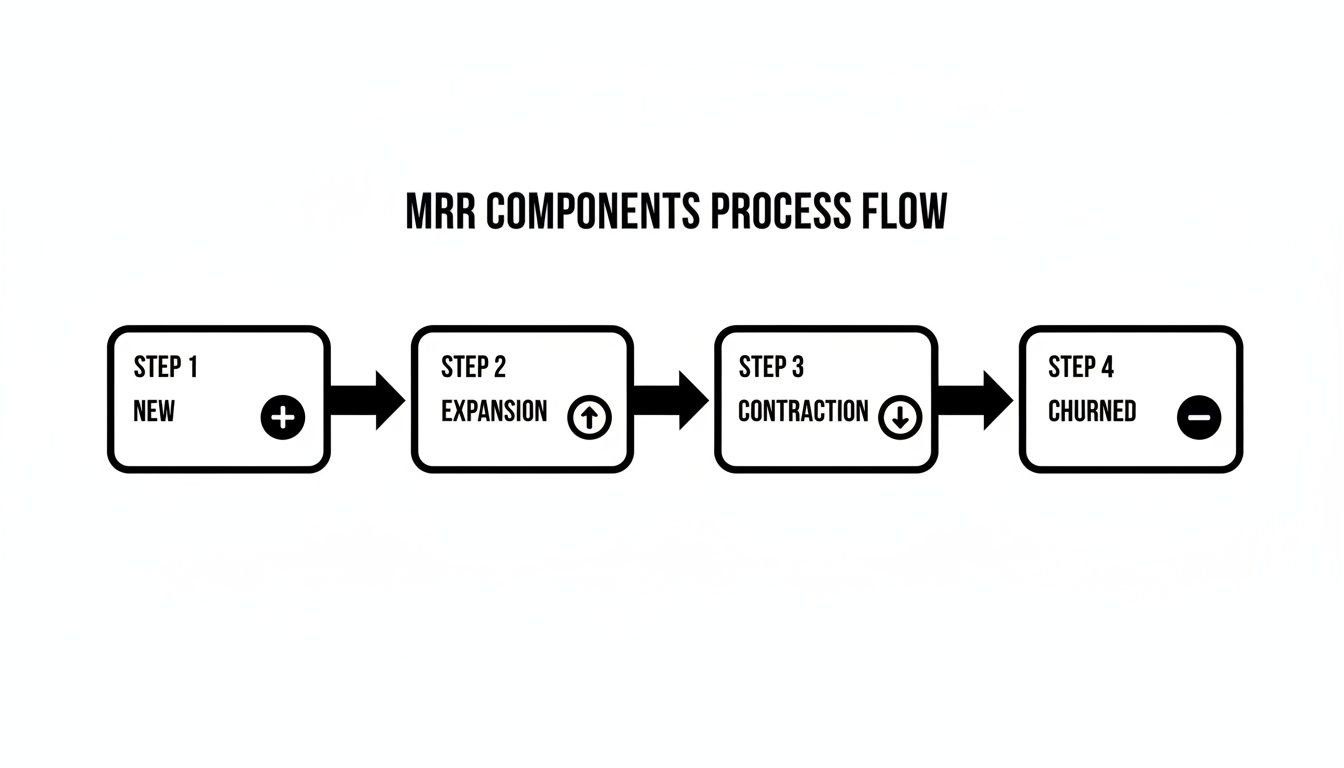
To get a true handle on your revenue, it helps to see MRR as a collection of four distinct movements. Each one tells a crucial part of your growth story.
The Core Components of MRR
Here’s a quick breakdown of the four key movements that make up your total MRR calculation.
| MRR Component | What It Measures |
|---|---|
| New MRR | The revenue you've generated from brand-new customers who signed up this month. |
| Expansion MRR | Revenue growth from your existing customers, like plan upgrades or add-on purchases. |
| Contraction MRR | The flip side of expansion—revenue lost from existing customers who downgraded their plans. |
| Churned MRR | The total monthly revenue you've lost from customers who canceled their subscriptions completely. |
This detailed approach isn't just good practice; it's become a strategic necessity. The subscription economy is exploding and is projected to hit $1.5 trillion by 2025. In this environment, you have to know your numbers inside and out.
It's also worth noting that recent industry data shows up to 46% of subscription revenue now comes from upgrades and upsells. This stat alone shows just how massive of a role Expansion MRR plays in sustainable growth.
Key Takeaway: A static MRR figure is just a number. The true insight lies in analyzing the flow of New, Expansion, Contraction, and Churned MRR to understand how your revenue is changing month over month.
By tracking these individual pieces, you get a much sharper picture of your business's health. You can pinpoint which levers are actually driving growth and where you might be leaking revenue. This allows you to make much more informed decisions. These insights are the foundation for building powerful dashboards and reports, especially when using tools that provide embedded analytics for SaaS platforms.
This granular view turns MRR from a simple vanity metric into a powerful, actionable tool you can use to steer your company forward.
The Foundational Formulas for Calculating MRR
Alright, now that we've broken down the individual pieces, let's put them together. Calculating MRR isn't some dark art of accounting; it's basic arithmetic that tells a powerful story about your business's momentum. The first thing you need to figure out is your monthly change, which we call Net New MRR.
This one metric is your monthly report card. It captures the constant push and pull between revenue growth and revenue loss, telling you if you ended the month in a better place than you started.
The formula looks like this: Net New MRR = (New MRR + Expansion MRR) - (Churned MRR + Contraction MRR).
Think of it this way: you're just adding up all your wins (new customers and upgrades) and subtracting all your losses (cancellations and downgrades). What's left is the net change for the month.
Bringing the Numbers to Life
Let’s run through a quick, real-world scenario to make this concrete. We'll use a fictional SaaS company, "ConnectSphere." Let's say they started April with $10,000 in MRR.
Here’s what happened during the month:
- New MRR: Five new companies subscribed to their $100/month plan. That’s $500 in new revenue.
- Expansion MRR: Two happy customers upgraded from the $100/month plan to the $150/month plan. This adds $100 in expansion (2 customers x $50 difference).
- Contraction MRR: One customer on the $150/month plan downgraded to the $100/month plan, which means a $50 loss in contraction MRR.
- Churned MRR: Unfortunately, three customers on the $100/month plan canceled their subscriptions, resulting in a $300 loss from churn.
Plugging those numbers into our formula, we get:
($500 New + $100 Expansion) - ($300 Churned + $50 Contraction) = $600 - $350 = $250
ConnectSphere ended the month with a Net New MRR of $250. Even though they lost a few customers and had a downgrade, their growth efforts more than made up for it.
The diagram below gives you a great visual of how these different forces—the good and the bad—all flow together to shape your final MRR.
As you can see, MRR is always in motion, influenced by every single customer action.
Calculating Your Total MRR
So, what's ConnectSphere's final MRR for April? Once you have your Net New MRR, this last part is a breeze. You simply add the net change to whatever you started the month with.
Here’s the final, simple formula: Total MRR = Previous Month's MRR + Net New MRR.
For our example company, it would be:
$10,000 (Start of April) + $250 (Net New MRR) = $10,250.
By following this process, you take all the guesswork out of your performance. You're no longer just guessing if you had a "good month." You get a precise, data-backed picture of your company's health, and more importantly, you can pinpoint exactly why you grew or why you stalled.
A Practical Look at Each MRR Component
To truly get a handle on your monthly recurring revenue, you have to look past the final number. The real story—the one that actually helps you make smart decisions—is in the individual pieces that make up your total MRR. Think of it like a business health check-up. The final report is good to have, but the individual test results tell you exactly where you’re strong and where you need to focus your attention.

Each of these components reveals something different about your relationship with your customers, from that first sale to their long-term loyalty. Let’s dig into each one with some real-world SaaS scenarios.
New MRR: The Engine of Acquisition
This is the most straightforward piece of the puzzle. New MRR is simply the total monthly revenue you bring in from brand-new customers.
Let's say you sign up ten new customers this month on your $49/mo plan. Boom—you've just added $490 in New MRR. This metric is a direct reflection of your sales and marketing efforts. It answers the question, "How good are we at bringing new paying customers into the fold?" A healthy, growing New MRR number is a clear sign that your top-of-funnel strategies are hitting the mark.
Expansion MRR: The Proof of Value
If you ask me, Expansion MRR is the most powerful indicator of a healthy, scalable SaaS business. It’s the extra monthly revenue you generate from existing customers who upgrade their plans or buy add-ons.
Imagine a customer on your $99/mo "Pro" plan realizes they need more firepower and moves to the $199/mo "Business" plan. That one move just created $100 in Expansion MRR. This isn't just more revenue; it's a huge vote of confidence. It means your product is so valuable that customers are willing to dig deeper into their pockets to get even more out of it.
Pro Tip: High Expansion MRR is a classic sign of strong product-market fit. It's also far cheaper to grow revenue from the customers you already have than to constantly hunt for new ones, making this an incredibly efficient way to grow.
Contraction and Churned MRR: Where You're Leaking Revenue
Now for the other side of the coin. These two components are the necessary reality check, showing you exactly where revenue is slipping through the cracks.
- Contraction MRR: This is the revenue you lose when existing customers downgrade to a cheaper plan. If someone moves from your $199/mo plan down to the $99/mo plan, you've just logged $100 in Contraction MRR.
- Churned MRR: This is the total revenue lost when a customer cancels their subscription completely. If five customers on your $49/mo plan decide to leave, you’ve lost $245 in Churned MRR.
Keeping a close eye on these numbers is non-negotiable. A sudden spike in churn might point to a buggy new feature, a competitor's aggressive new offer, or a dip in customer support quality. That's why we put together a whole guide on how to reduce churn rate for SaaS businesses.
But here’s an interesting twist: churn isn’t always a final goodbye. The global subscription economy has exploded by an incredible 435% in the last decade, and customer behavior is more complex than ever. Research from RevenueCat shows that 67% of businesses report that up to 20% of their churned customers actually come back within six months. This means "lost" MRR often finds its way back, which is why tracking reactivations as its own component is so important.
Common Mistakes That Can Invalidate Your MRR
Knowing how to calculate monthly recurring revenue is one thing, but knowing what not to include is what really keeps your data clean and trustworthy. I've seen it happen time and again—a small miscalculation ripples through an entire financial model, leading to flawed projections and, ultimately, poor strategic decisions. When it comes to MRR, precision is everything.

Many founders accidentally inflate their numbers by lumping in revenue streams that aren't truly recurring. It’s an easy mistake to make, but it creates a false sense of security and can mask underlying issues with customer retention or acquisition. Let's walk through the most common pitfalls so you can steer clear of them.
One-Time Fees Are Not Recurring
This is, without a doubt, the most frequent error I see. Any one-time charge—think setup fees, consultation costs, or training sessions—needs to be kept completely separate from your MRR calculation. Yes, it’s real revenue for your business, but it's not predictable monthly income.
Including these figures will cause your MRR to spike in months with high onboarding activity, giving you a very misleading picture of your sustainable growth. Always isolate these payments and track them as non-recurring revenue.
Mismanaging Annual Contracts
Another classic mistake is booking an entire annual contract in the month it was signed. It's tempting, I get it. If a customer pays you $1,200 for a yearly plan in January, you can't just count $1,200 as January's MRR.
The only correct approach is to normalize it. You should recognize $100 of that revenue each month over the 12-month contract. This amortization ensures your MRR accurately reflects the consistent, predictable value that customer brings over time, not just a one-off cash injection.
The core principle of MRR is predictability. If a revenue stream isn't guaranteed to repeat next month under the same terms, it doesn't belong in your calculation.
Forgetting About Discounts and Coupons
Discounts and promotional offers can also muddy the waters if you aren't careful. Your MRR calculation must reflect the actual amount a customer pays you each month, not the sticker price of their plan.
Here's a quick breakdown of how to handle it:
- Initial Discount: A customer signs up for a $100/mo plan but gets 50% off for the first three months. Their contribution to your MRR is $50 for those initial months.
- Discount Ends: Once that promotion expires, their contribution automatically increases to $100. You'll see this reflected as a $50 increase in your Expansion MRR for that month.
Failing to account for these adjustments is a surefire way to overstate your revenue.
Ignoring Failed Payments and Involuntary Churn
Finally, don't count revenue from customers with failed payments. If a credit card gets declined, that customer is no longer contributing to your MRR for that month—even if they haven't actively canceled their subscription. This is what we call involuntary churn.
Many payment systems will automatically retry the charge, but until that payment successfully processes, the revenue is at risk. Keeping these delinquent accounts in your active MRR total artificially inflates your numbers and hides a potentially serious issue with your dunning process. Clean data is absolutely critical for making sound business decisions.
What to Include vs. Exclude in MRR Calculations
To make this crystal clear, here’s a simple table that separates what belongs in your MRR from what doesn't. Think of this as your cheat sheet for maintaining accurate metrics.
| Include in MRR | Exclude from MRR |
|---|---|
| Recurring Subscription Fees | One-Time Setup/Implementation Fees |
| Recurring Add-Ons or Upgrades | Consulting or Professional Services Fees |
| Seat/User-Based Recurring Charges | Hardware or Equipment Sales |
| Discounts (the net amount paid) | Usage/Overage Fees (unless they are committed) |
| Monthly Amortization of Annual Contracts | Credit Adjustments or Refunds |
| Transaction Fees or Processing Costs |
Getting this right isn't just about bookkeeping; it's about having a true, unvarnished view of your company's health. Use this table as a gut check every time you're reviewing your numbers.
Turning MRR Data Into Strategic Growth Actions
Figuring out your Monthly Recurring Revenue is one thing, but that’s really just the first step. The true value of MRR isn't in the number itself—it's in how you use that number to make smarter, faster decisions for your business. It stops being a vanity metric and becomes a predictive tool for real, sustainable growth.
For instance, when you start tracking your MRR growth rate, you can move past pure guesswork and begin setting realistic forecasts and targets. It’s the difference between merely hoping for growth and actually building a concrete plan to get there.
But the gold is hidden deeper. The most powerful insights come when you start slicing your MRR into smaller, more meaningful pieces. When you segment your data, you uncover the hidden stories that a single, top-line number just can't tell you.
Uncovering Hidden Growth Levers
Segmenting your MRR is like putting your revenue under a microscope. Instead of one blurry image, you suddenly get a crystal-clear view of what’s actually driving your business forward. This lets you stop wasting time and money on low-impact activities and double down on what’s truly working.
Think about segmenting your MRR in these ways:
- By Pricing Tier: Are customers on your "Pro" plan sticking around longer than those on the "Basic" tier? Maybe your higher-tier plans have stickier features that are worth emphasizing.
- By Customer Cohort: Do customers who signed up back in Q1 have a higher lifetime value than those who joined in Q4? This could point to a particularly successful marketing campaign you ran earlier in the year.
- By Acquisition Channel: You might find that customers who come from your referral program generate double the Expansion MRR compared to those from paid ads.
That last point is a game-changer. It’s where you connect MRR to other critical SaaS metrics like Customer Acquisition Cost (CAC) and Lifetime Value (LTV). While subscription businesses see an average growth of 18% year-over-year, the most successful ones are ruthlessly efficient. You have to know if a dollar of MRR from a referral brings a higher LTV or lower churn than a dollar from a paid ad.
By segmenting your MRR, you can pinpoint your most profitable customer types and acquisition channels, allowing you to allocate your budget with surgical precision.
This kind of analysis is the bedrock of understanding your unit economics. If you’re ready to go deeper, our guide on how to calculate SaaS customer lifetime value offers a complete framework for connecting these essential metrics.
Systematizing Your MRR Analysis
To consistently turn your MRR data into action, you need a process. Many successful SaaS companies use a Quarterly Business Review (QBR) template to regularly assess performance and map out their next moves. This kind of structured approach ensures you're not just collecting data but actually acting on it every single quarter.
Ultimately, your MRR calculation should spark a series of strategic questions. Is our pricing optimized? Are our retention efforts focused on the right customers? Are we investing in the channels that deliver the most long-term value?
Answering these questions is how you transform a simple calculation into a powerful engine for growth.
Still Have Questions About Calculating MRR?
Even with the right formulas, things can get tricky when you start plugging in real-world numbers. Once you get into the weeds of calculating your monthly recurring revenue, you'll inevitably run into some edge cases that make you second-guess your approach. Let's tackle the most common questions head-on so you can handle these nuances with confidence.
What Do I Do with Annual Subscriptions?
This is probably the most frequent question I hear. When a customer pays you $1,200 upfront for a full year, you need to spread that revenue out evenly across the entire 12-month contract. That means you only recognize $100 of that payment as MRR each month.
I know it’s tempting to log the entire $1,200 in the month you close the deal—it feels great to see a big spike! But doing that completely warps your data and paints a false picture of your predictable monthly income. This process of spreading out the revenue, sometimes called amortization, is absolutely critical for keeping your MRR metrics honest and accurate.
Remember This: The whole point of MRR is to track predictable, recurring revenue. A big annual payment is a cash flow event, not a reflection of your monthly performance. Spreading it out keeps your growth metrics grounded in reality.
Should I Count Free Trials or Freemium Users?
Simple answer: Nope. By its very definition, MRR only tracks revenue from paying customers. Someone on a free trial or a freemium plan isn't paying you anything on a recurring basis, so they have to be excluded from your MRR calculations entirely.
The moment they pull out their credit card and convert to a paid subscription, that's when they contribute to your New MRR. Keeping free and paid users separate isn't just a "nice-to-have" best practice—it's fundamental for accurate financial reporting and for truly understanding how well your free plans convert.
How Is MRR Different from Overall Revenue?
It’s easy to mix these up, but they measure two completely different aspects of your business. Think of MRR as a specialized metric that focuses only on the predictable, recurring income from your subscriptions. It's built to give you a clear view of the stable, ongoing financial health of your SaaS business.
Overall revenue, on the other hand, is a much wider net. It's an accounting term that scoops up all the money your company brings in. This includes things like:
- One-time setup fees
- Professional services or consulting projects
- Hardware sales
- Any other non-recurring payments
For any subscription company, MRR is the truer signal of sustainable, long-term growth. Total revenue can jump around based on one-off projects, but a steadily climbing MRR proves your core business model is healthy and predictable month after month.
Ready to turn customers into your best marketers? Refgrow makes it easy to launch a fully native affiliate program inside your SaaS with just one line of code. Track referrals, manage commissions, and scale your growth loops effortlessly. Get started with Refgrow today.