Measuring Marketing Campaign Effectiveness: Proven Strategies

Measuring the impact of a marketing campaign isn't just about crunching numbers; it's a structured process that links your team's hard work directly to business results. It all boils down to setting clear goals, zeroing in on the right Key Performance Indicators (KPIs), analyzing the data you gather, and then using those insights to make your next campaign even better. This is how you prove that every dollar you spend is pushing the company forward.
Why Effective Campaign Measurement Matters
Let's be blunt: running a marketing campaign without measuring it is like driving a car with a blindfold on. You're definitely moving, but you have no clue if you're headed toward your destination or a ditch. When you don't track your campaigns properly, you're just burning through your budget, creating friction between marketing and sales, and ultimately putting the brakes on growth. The old "launch and pray" method simply doesn't cut it anymore.
Proper measurement is your GPS. It shows you precisely what’s hitting the mark with your audience and what's a complete miss. This process gives you the evidence you need to justify your budget, demonstrate your team's value, and make smart, data-backed decisions that actually affect the bottom line. It's the difference between guessing and knowing.
To put it into perspective, here's a high-level look at the framework we'll be breaking down.
The 5-Step Campaign Measurement Framework
| Phase | Objective | Key Action |
|---|---|---|
| 1. Define Goals | Establish clear, measurable objectives for the campaign. | Align marketing goals with overall business objectives (e.g., increase leads by 15%). |
| 2. Select KPIs | Choose the right metrics to track progress toward your goals. | Pick KPIs that directly reflect success (e.g., Conversion Rate, CPA). |
| 3. Implement Tracking | Set up the necessary tools to collect accurate data. | Configure analytics, pixels, and UTM parameters before launch. |
| 4. Analyze Results | Interpret the data to understand campaign performance. | Compare results against benchmarks and segment data for deeper insights. |
| 5. Optimize & Report | Use insights to improve future campaigns and share findings. | Make data-driven adjustments and communicate the campaign's ROI. |
This table outlines the continuous loop that turns good marketing into great marketing—it's a cycle of constant learning and improvement.
The Foundation of Successful Marketing
At its core, measuring marketing effectiveness is a simple, repeatable cycle. You start by defining what success looks like, which tells you exactly what metrics to track. That data then becomes the fuel for optimizing everything you do moving forward.
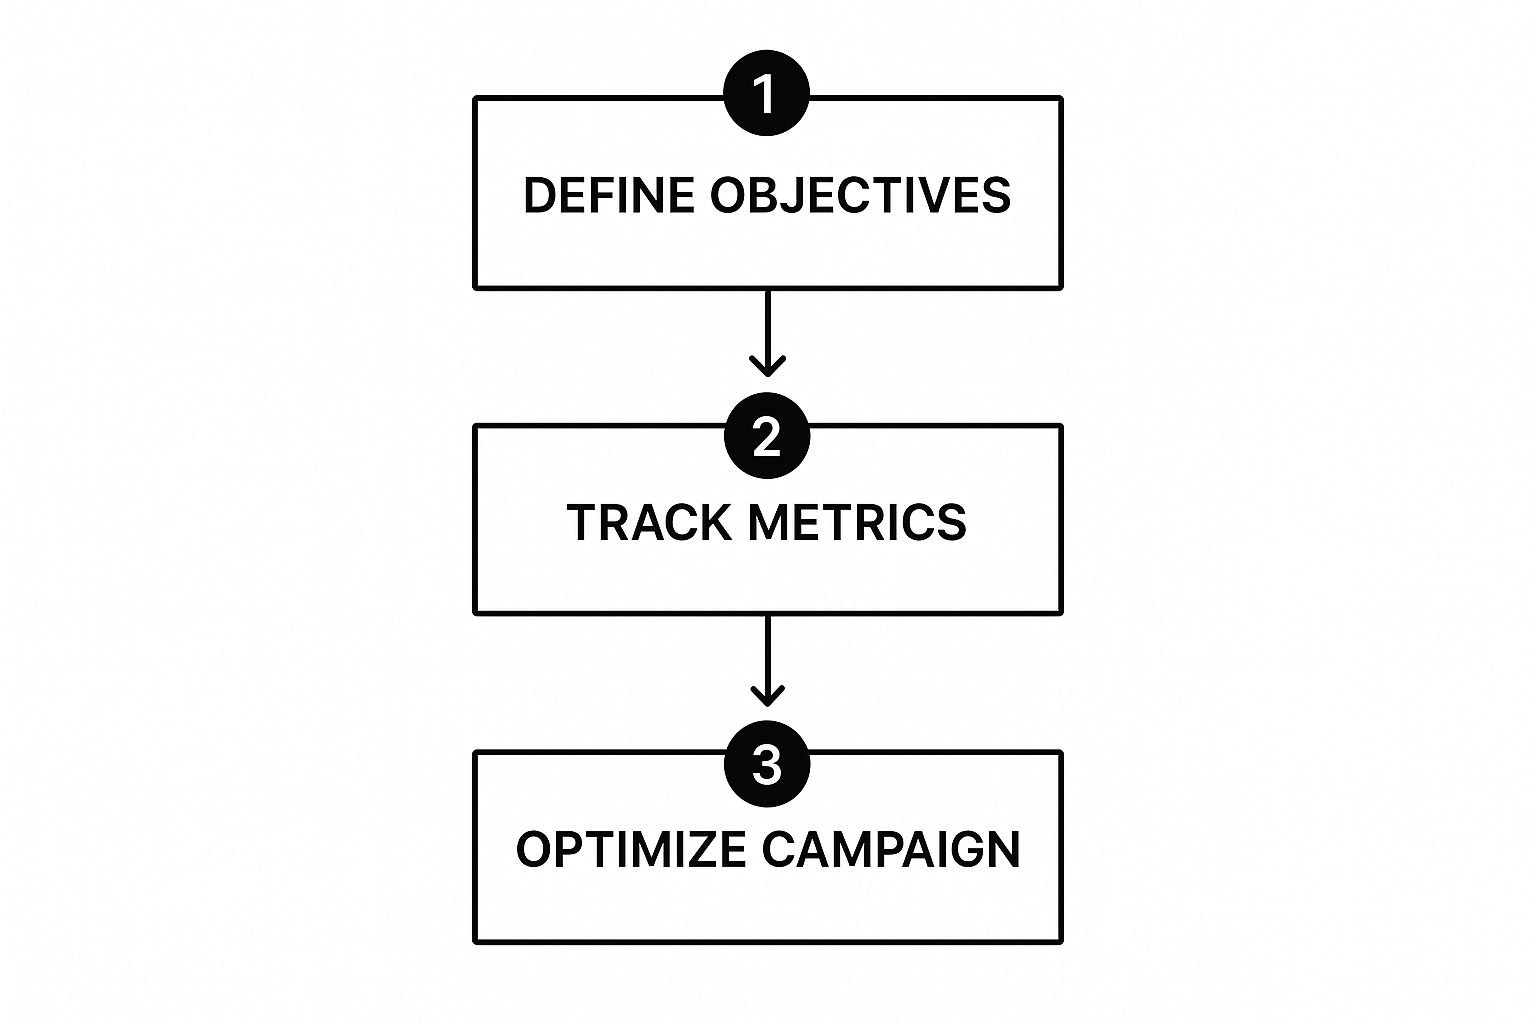
This cycle isn't a one-and-done task. It's an ongoing process that keeps your marketing sharp, relevant, and effective. Without this structure, your efforts are just shots in the dark.
Connecting Actions to Real-World Value
The global push for better measurement is undeniable. The digital advertising and marketing market was recently valued at $667 billion and is expected to climb to $786.2 billion by 2026. This incredible growth is happening for one reason: businesses are getting better at proving the ROI of their digital efforts, which is why 63% of them have recently increased their digital marketing budgets.
Key Takeaway: The ultimate goal is to get past vanity metrics like social media likes or impressions. Instead, you need to focus on what truly moves the needle—revenue, customer acquisition cost (CAC), and lifetime value (LTV). Every piece of data you collect should help you answer one simple question: "Did this campaign help us hit our business goals?"
For example, a high click-through rate feels good, but it’s infinitely more valuable to know how many of those clicks turned into actual paying customers. Likewise, digging into your referral program metrics gives you a much clearer picture of how word-of-mouth is driving sustainable growth. This guide will walk you through a straightforward framework to help you do just that.
Setting Goals That Actually Drive Business Value

If your marketing goals are vague, your results will be too. I’ve seen it time and time again: a campaign starts with a fuzzy objective and ends with a fuzzy report. Real measurement doesn't start with an analytics dashboard—it starts with defining exactly what you want to achieve in a way that matters to the business's bottom line.
Without that clarity, you end up chasing metrics that feel good but accomplish nothing. "Increase brand awareness" or "get more traffic" are the kind of goals that are impossible to measure meaningfully. To show you’re making a real impact, you have to move from those fluffy ideas to concrete outcomes that get the C-suite’s attention.
Adopting the SMART Framework
There's a reason the SMART framework is a classic. It’s a simple but powerful tool that forces you to turn broad ambitions into sharp, actionable targets. It makes sure every goal is Specific, Measurable, Achievable, Relevant, and Time-bound.
Let's see how this works in practice.
- Vague Goal: "Increase website traffic."
- SMART Goal: "Boost organic traffic from non-branded keywords by 15% within the next quarter by publishing eight new blog posts and acquiring ten high-quality backlinks."
See the difference? The second goal isn't just a wish; it’s a mini-plan. It tells you what kind of traffic to focus on, gives you a clear target, and even outlines the tactics you'll use to get there within a specific timeframe.
Connecting Campaign Goals to Business Objectives
The best marketing goals don't exist in a vacuum. They need to be a direct reflection of what the entire company is trying to achieve. Think of yourself as the bridge between the company's high-level vision and the day-to-day work of your marketing campaigns.
For example, if the big business objective is to grow market share in the enterprise sector, a goal about getting more Instagram followers is completely misaligned. You need to focus on what will actually support that business outcome.
A much better campaign goal would be to generate 500 new marketing-qualified leads (MQLs) from companies with over 1,000 employees in Q3. This directly supports the larger objective and gives your work a clear purpose that everyone, from sales to the CEO, can understand.
When you tie your campaign goals directly to business objectives, you change the conversation. You're no longer talking about "marketing activities"; you're talking about "business impact." This is how you prove marketing is a revenue driver, not just a cost center.
To make this connection even tighter, you need to speak the language of business. That means getting comfortable with e-commerce growth metrics like LTV and CAC. Understanding these concepts helps you set targets that are grounded in financial reality.
Choosing KPIs That Matter
Once you have your SMART goals locked in, picking the right Key Performance Indicators (KPIs) is the next logical step. KPIs are the specific data points you'll track to see if you're on the right path. They're the vital signs of your campaign.
The trick is to steer clear of "vanity metrics." These are the numbers—like impressions or raw page views—that look impressive but don't actually correlate with business success. A million impressions mean nothing if they don't lead to a single sale.
Here’s how you can align KPIs with a specific goal:
| SMART Goal | Primary KPIs to Track | Why They Matter |
|---|---|---|
| Generate 500 qualified leads in Q3. | Number of MQLs, Cost Per MQL, Conversion Rate (Lead to MQL). | These directly measure lead volume, cost efficiency, and the quality of incoming leads. |
| Increase customer retention by 10% this year. | Churn Rate, Customer Lifetime Value (CLV), Repeat Purchase Rate. | These metrics focus on the long-term value and loyalty of your existing customer base. |
| Reduce Customer Acquisition Cost (CAC) by 20%. | Cost Per Click (CPC), Conversion Rate, Total Marketing Spend. | Tracking these helps pinpoint where you can optimize ad spend and improve funnel efficiency. |
Choosing the right KPIs keeps your team focused on what actually moves the needle. If you want to get a firm grasp on one of the most important metrics, check out our guide on how to calculate customer acquisition cost. Mastering this is fundamental to proving your strategic value.
Building Your Campaign Measurement Toolkit
There’s a simple truth in marketing that you can't escape: you can't measure what you can't track. Before you can analyze a single click or conversion, you have to get your technology stack right. This isn't about spending a fortune, but it is about being thoughtful in how you collect clean, reliable data right from the start.
Think of your measurement tools as the nervous system for your entire marketing strategy. Each tool acts like a receptor, picking up signals from different points in the customer journey. When you connect them properly, they paint a full picture of what’s working, what isn't, and most importantly, why. The goal here is to move from guesswork to data-driven confidence.
Starting with the Essentials: Google Analytics 4
For nearly everyone, the journey begins with Google Analytics 4 (GA4). This free, incredibly powerful platform is the bedrock for understanding how people actually behave on your website or app. We've moved past the old days of just counting pageviews; GA4 is built around an event-based model, which is a perfect fit for measuring the specific actions that tie back to your campaign goals.
Properly setting up GA4 is absolutely non-negotiable. This means you have to go beyond the out-of-the-box installation and define the custom events and conversions that are truly meaningful to your business.
- Event Tracking: Make sure you're tracking key interactions. This could be anything from form submissions and video plays to demo requests or newsletter sign-ups.
- Conversion Goals: Of those events, flag the most critical ones as conversions. This is usually a completed purchase or a lead form submission.
- Audience Building: Create specific audience segments. This lets you analyze how different groups, like users from a specific campaign, behave compared to others.
Getting this foundation right ensures the data flowing into your analytics is accurate and useful from day one. For a deeper look at the technical side, our documentation covers advanced tracking methodologies and integrations.
Connecting Marketing Efforts to Sales with a CRM
While GA4 is fantastic at telling you what happens on your site, it can't show you the final outcome—the sale. That’s where a Customer Relationship Management (CRM) system like Salesforce or HubSpot comes into play. By integrating your marketing platforms with your CRM, you finally close the loop between a click and a paying customer.
This connection is what allows you to follow a lead from their very first touchpoint—maybe clicking a social media ad—all the way through your sales pipeline. This is the only way to accurately calculate one of the most vital business metrics: Customer Lifetime Value (CLV). Once you know the CLV of customers acquired from different campaigns, you can make much smarter decisions about where to put your budget.
Your CRM is more than a sales tool; it's a marketing intelligence engine. Integrating it with your analytics allows you to attribute real revenue to specific campaigns, proving your direct impact on the bottom line.
Demystifying UTM Parameters for Clear Attribution
So, how do you tell Google Analytics exactly where your website traffic is coming from? The answer is simple and powerful: Urchin Tracking Module (UTM) parameters. These are just small tags you add to the end of a URL to identify the source, medium, and campaign name for every link you share.
Using UTMs consistently is a non-negotiable best practice. Without them, all your hard-earned social media traffic might get lumped into "Direct" or a generic referral source. That makes it completely impossible to know which specific ad or post actually drove a visit.
Let's walk through a real-world example for a summer sale campaign on Facebook.
The Base URL: https://yourstore.com/summer-sale
The UTM Parameters:
utm_source=facebook(Where did the traffic come from?)utm_medium=cpc(What kind of marketing was it? Here, cost-per-click.)utm_campaign=summer_sale_2024(What's the campaign name?)utm_content=blue_dress_ad(Which specific ad or link was clicked?)
The Final Tagged URL:https://yourstore.com/summer-sale?utm_source=facebook&utm_medium=cpc&utm_campaign=summer_sale_2024&utm_content=blue_dress_ad
Now, when someone clicks this link, GA4 automatically logs all that information. You can then instantly filter your reports to see exactly how your summer_sale_2024 campaign performed on Facebook.
Visualizing Your Data with Dashboards
The final piece of your toolkit is a way to pull all this data together into a format that’s easy to understand. Data visualization tools and dashboard builders are essential for this. Whether it’s Google Looker Studio, Tableau, or even a well-made spreadsheet, the goal is the same.
A good dashboard tells a story at a glance. It should surface your most important KPIs, helping you spot trends, identify problems, and share results with stakeholders without drowning them in rows of raw data. By connecting GA4, your CRM, and your ad platforms to a central dashboard, you create a single source of truth for your campaign performance.
Turning Raw Data Into Actionable Insights
Collecting a mountain of data is one thing; knowing what to do with it is another game entirely. The real work begins when you start translating all those numbers into a clear story that tells you exactly what to do next.
Staring at a high-level metric like "total conversions" won't get you very far. It doesn't explain why a campaign soared or why it fell flat. The magic happens when you start digging in, slicing up your data, and getting to the context behind the numbers. This is how you move from just looking at results to taking meaningful action.
Segment Your Audience to Find the Real Story
Your audience isn't one big, uniform group. People coming from different channels, living in different places, or using different devices will behave in completely different ways. Segmentation is your key to unlocking these hidden patterns by breaking down your data into smaller, more focused groups.
Imagine your overall campaign conversion rate is a decent 4%. On the surface, that seems okay. But once you segment, you might find that mobile users from your email list are converting at a whopping 8%, while desktop users from paid search are barely hitting 1%. Now that's an insight you can act on.
Here are a few of the most powerful ways to start segmenting your data:
- By Channel: Go beyond just traffic numbers. Compare email, social, organic search, and paid ads to see which channels are driving the most valuable customers—the ones who actually convert.
- By Demographics: Look at performance by age, gender, or location. You might be surprised to find a new ad is a massive hit with a younger demographic you weren't even targeting.
- By Device: Always compare desktop, mobile, and tablet performance. A huge bounce rate on mobile is often a red flag for a clunky user experience that's bleeding conversions.
This granular view tells you where to double down on your budget and where you need to make some serious changes.
Choosing the Right Attribution Model
So, where should the credit for a conversion actually go? It's rarely a straight line. A customer's journey almost always involves multiple touchpoints—they might see a social ad, click an email link a week later, and then finally make a purchase through a Google search. Attribution modeling is how you figure out which of those steps mattered most.
Picking the right model is a big deal because it shapes how you value every single channel in your marketing mix. And for campaign measurement, being able to analyze this information as it comes in is a game-changer. You can learn a lot more by checking out resources on Mastering Real-Time Data Analytics.
There’s no single "best" model; the right choice really depends on your business and how long it typically takes for someone to become a customer. Here’s a quick look at the most common models to help you find your fit.
Choosing the Right Attribution Model
| Attribution Model | How It Works | Best For |
|---|---|---|
| First-Touch | Gives 100% of the credit to the very first interaction a customer had with your brand. | Campaigns focused on building brand awareness and generating new leads at the top of the funnel. |
| Last-Touch | Gives 100% of the credit to the final touchpoint right before the conversion. | Businesses with short sales cycles where the final click is what really seals the deal. |
| Linear | Distributes credit equally across every single touchpoint in the customer's journey. | Companies with long sales cycles where you want to value every interaction that kept the lead warm. |
| Time-Decay | Gives more credit to the touchpoints that happened closer in time to the conversion. | B2B marketing or for high-consideration purchases where recent touchpoints are more persuasive. |
A great attribution model helps you understand the entire customer journey, not just the final click.
Pro Tip: Don't just pick one model and stick with it forever. Jump into Google Analytics and use the Model Comparison Tool. It lets you see your data through different lenses, revealing which channels are great for introducing new customers and which are better at closing the deal.
Context Is Everything: Benchmark Your Results
A 2% conversion rate means nothing on its own. Is that good? Bad? Who knows! The only way to find out is to put it in context by benchmarking it against your own past results and what’s happening in your industry.
Internal Benchmarking is your most crucial comparison. How does this campaign stack up against the one you ran last quarter? Tracking metrics month-over-month or year-over-year helps you spot trends. A sudden dip might signal a problem, but a steady climb shows your strategy is paying off.
External Benchmarking involves looking at industry reports and studies to find average conversion rates, click-through rates, or cost-per-acquisition (CPA) in your field. While the data isn't as precise, it gives you a reality check. If your CPA is 50% higher than the industry average, that's a clear sign you need to take a hard look at your targeting or ad spend.
When you bring segmentation, attribution, and benchmarking together, you’re no longer just looking at data. You’re building a strategic roadmap that answers not just "what happened," but "why it happened" and "what we should do next."
Optimizing Performance and Proving Your Value

Alright, this is where all your hard work starts to pay off. You’ve waded through the data and surfaced some real insights—now it's time to close the loop. This means turning those findings into tangible improvements and, just as importantly, showing everyone the wins. This is how you stop just reporting on marketing and start driving growth with it.
This continuous feedback loop is really what separates the good marketers from the great ones. It's all about taking what you've learned and making smarter decisions, whether that means tweaking a headline or confidently shifting a six-figure budget. The goal is to build a cycle of relentless improvement.
From Insights to Actionable Optimization
Your data isn't just a report card; it's a roadmap for what to do next. Instead of guessing what might work better, you can now use hard evidence to systematically boost performance. One of the best ways I’ve found to do this is with good old-fashioned A/B testing.
This methodical approach lets you isolate and test one variable at a time to see what truly resonates with your audience. Don't just stick to the obvious stuff; test anything that could make a difference.
- Ad Creatives: Pit two different images or videos against each other. Which one gets you a lower Cost Per Click (CPC)?
- Landing Page Headlines: Try a benefit-driven headline versus a feature-focused one. Does one deliver a better conversion rate?
- Calls-to-Action (CTAs): Test button colors, text ("Get a Demo" vs. "See it in Action"), or even placement on the page. You'd be surprised what prompts more people to click.
By constantly testing and rolling out the winners, you achieve small, incremental gains that really compound over the life of a campaign.
Smart Budget Reallocation
One of the most powerful things that comes from solid measurement is the confidence to move your money around. Your data will paint a clear picture of which channels are your workhorses and which are just along for the ride. The next step is to act on that information—decisively.
Imagine your dashboard shows that LinkedIn ads are generating MQLs at half the Cost Per Acquisition (CPA) of your Google Ads campaign. The logical move? Shift some of that Google budget over to LinkedIn and scale what's already working. This isn't about admitting failure; it's a strategic pivot based on evidence, making sure every dollar is working as hard as it possibly can.
This is how you defend your budget—and ask for more. When you can walk into a meeting and say, "We moved $10,000 from Channel X to Channel Y and increased our lead volume by 25% while keeping our CPA flat," you're not just reporting metrics. You're demonstrating real business impact.
For example, we've seen how effective video advertising has become. Campaigns that blend brand-building with direct response have shown a 9% higher ROI than those focused only on awareness. Data like this proves how a full-funnel strategy on a platform like YouTube can drive better performance and justify your investment. You can always discover more insights about current marketing trends to stay ahead.
Reporting That Tells a Story
Finally, you have to prove your value by communicating results in a way people actually understand. Forget emailing stakeholders a massive spreadsheet and hoping they find what’s important. Your job is to build clear, concise reports and dashboards that tell a compelling story.
And remember, different people care about different things. You need to create customized views that speak directly to their priorities.
- For Your Team (The "In the Weeds" View): This is your daily or weekly dashboard. It’s packed with granular metrics like CTR, CPC, and Conversion Rate by ad set. This is for the people making day-to-day tactical tweaks.
- For Your Manager (The "Performance" View): A weekly report is perfect here. Focus it on core KPIs like Leads Generated, CPA, and ROAS. This view shows how you're tracking against your department's goals.
- For Executives (The "Business Impact" View): They need a monthly or quarterly summary. Highlight the big-picture stuff like Customer Lifetime Value (CLV) from your campaigns and overall ROI. This connects your marketing efforts directly to revenue and the bottom line.
By tailoring your reporting, you make sure everyone sees the value of your work in a context that matters to them. This loop of analyzing, optimizing, and reporting is what drives sustainable growth and cements marketing's role as a critical driver of the business.
Frequently Asked Questions
Even with a perfect plan on paper, questions always pop up once you get your hands dirty. Let's tackle some of the most common hurdles marketers face when they start trying to measure how well their campaigns are really doing.
How Often Should I Check My Campaign Performance?
There's no magic number here, but a good rule of thumb is to match your check-in frequency to the speed of the channel you're using.
For fast-paced channels like Google Ads or social media advertising, you’ll want to be in there daily, or at the very least, a few times a week. Things move quickly, and a small dip in performance can spiral if you don't catch it early. This lets you tweak bids, swap out creative, or adjust your targeting on the fly.
But for the long-game stuff like SEO and content marketing, looking at the data every day will drive you crazy. These strategies are all about building momentum over time. A monthly or even quarterly review makes a lot more sense. You're looking for broad trends, not reacting to tiny, meaningless data blips.
What’s the Difference Between ROI and ROAS?
It’s easy to mix these two up, but they tell you very different things about your campaign's financial health. Getting them straight is key for accurate reporting.
Return on Ad Spend (ROAS) is a pure-and-simple metric for your advertising. It answers the question: "For every dollar I put into ads, how much revenue did I get back?" The formula is just Revenue / Ad Cost. So, a 4:1 ROAS means you made $4 in revenue for every $1 you spent on that specific ad campaign.
Return on Investment (ROI) takes a much bigger, strategic view. It measures the actual profit from your marketing efforts after you subtract all the costs involved—not just ad spend, but also software, creative production, and even your team’s salaries. The formula is ((Net Profit - Investment) / Investment).
Think of it this way: ROAS tells you if your ads are efficient. ROI tells you if your overall marketing effort is actually profitable for the business. You can have a fantastic ROAS but still have a negative ROI if your other costs are too high.
How Can I Measure Offline Campaigns Like Print or Radio Ads?
Measuring offline marketing can feel like a black box, but the trick is to create a digital bridge that connects the physical ad to a trackable online action. You can't see who read your magazine ad, but you can see who took the next step because of it.
Here are a few ways I’ve seen this work really well:
- Unique Landing Pages: Don't just send people to your homepage. Create a specific, easy-to-remember URL (like
yoursite.com/offer) that you only use in that one print ad or on that billboard. All traffic to that page is a direct result of your offline campaign. - Dedicated Discount Codes: Offer a special promo code, like "PODCAST20," exclusively on a podcast or radio spot. When people use that code at checkout, you know exactly where that sale came from.
- Trackable Phone Numbers: Services like CallRail can give you a unique phone number for each offline campaign. This lets you count every single call generated from a specific flyer, TV commercial, or mailer.
By tying that offline activity to a clear, measurable online action, you can finally put a real number on its impact and see how it stacks up against your digital campaigns.
Ready to build a powerful referral program that's easy to track and scale? Refgrow lets you launch a fully native affiliate dashboard inside your SaaS with just one line of code. Start turning your best customers into your most effective marketers. Get started with Refgrow today!