7 Referral Program Metrics You Need to Track in 2025

Unlocking Referral Program Growth: Measuring What Matters
Referral programs are powerful growth engines, but only if optimized correctly. This listicle reveals seven key referral program metrics you must track for program success. Learn how to measure performance, identify areas for improvement, and unlock your program's full potential by analyzing metrics like referral conversion rate, participation rate, customer acquisition cost (CAC) from referrals, program ROI, average referrals per customer, referred customer lifetime value (LTV), and Net Promoter Score (NPS) correlation. These insights are crucial for maximizing growth and making your referral program a success.
1. Referral Conversion Rate
Referral Conversion Rate is arguably the most crucial referral program metric. It measures the percentage of referred leads that convert into paying customers. This metric provides direct insight into how effectively your referral program transforms recommendations and word-of-mouth marketing into tangible business growth. It's calculated by dividing the number of referred individuals who became customers by the total number of referrals received, and then multiplying by 100. A high referral conversion rate signifies that your program is attracting high-quality leads who are genuinely interested in your product or service.
This image provides a visual representation of how the Referral Conversion Rate is calculated. It clearly demonstrates the relationship between the number of referrals, converted referrals (those who become customers), and the resulting conversion rate.
This metric deserves a top spot in any list of essential referral program metrics because it directly reflects the ROI of your referral program. By tracking and analyzing your referral conversion rate, you can gain valuable insights into your target audience, refine your referral incentives, and optimize your overall marketing strategy.
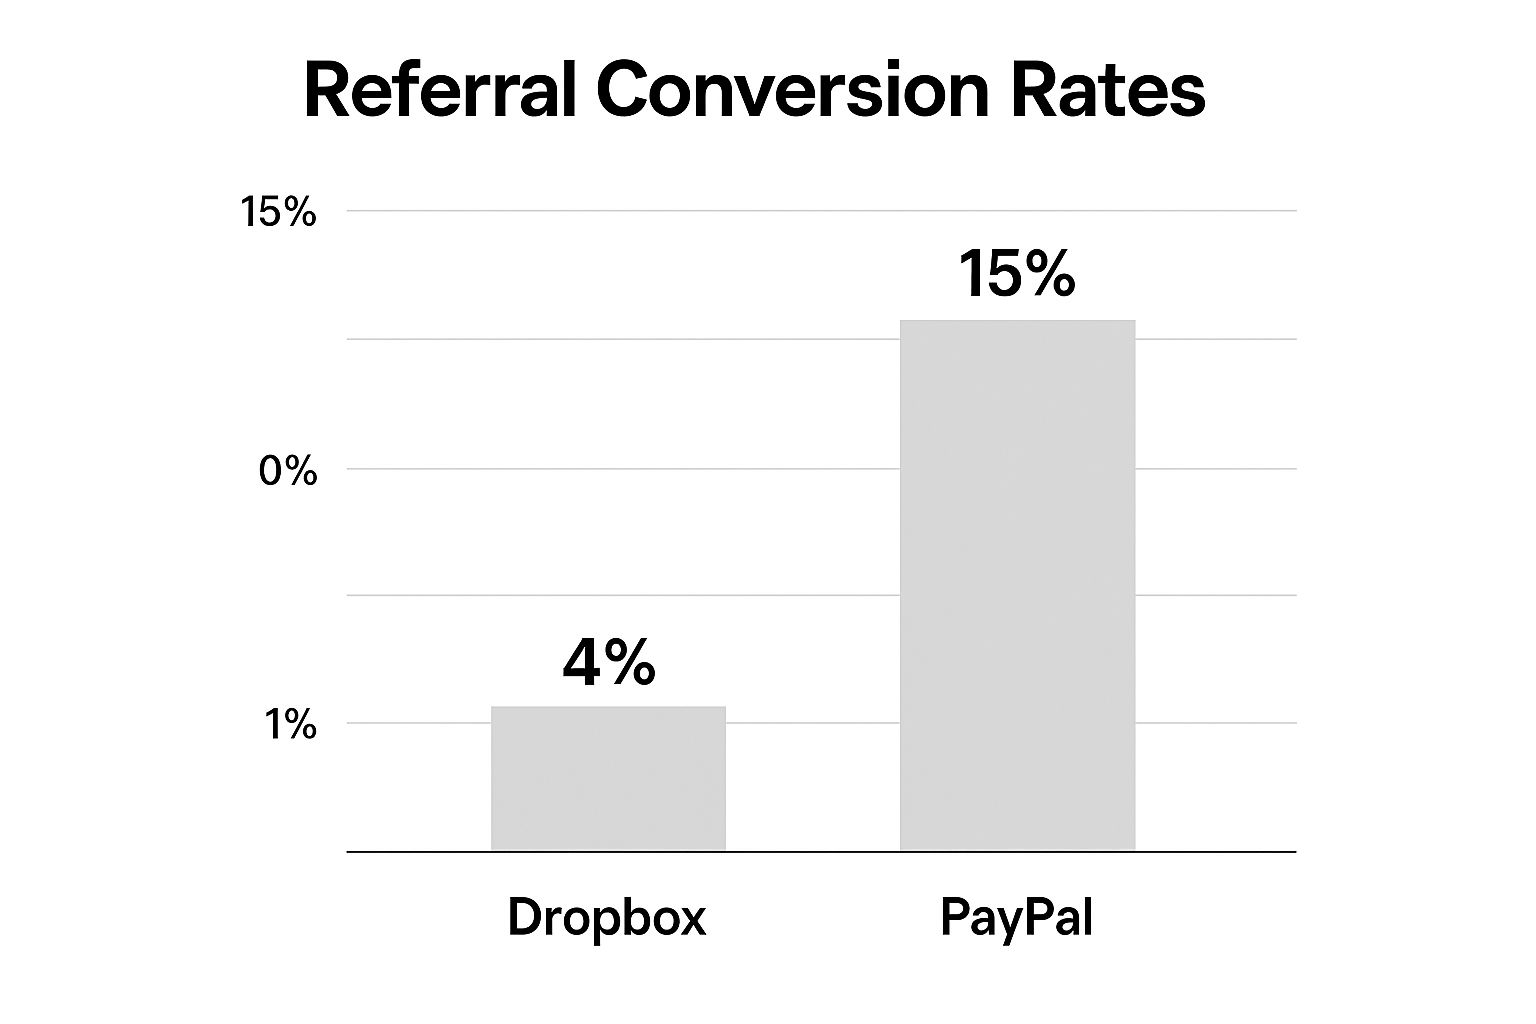
The following infographic visualizes data comparing the conversion rates of different customer acquisition channels, including paid advertising, organic search, email marketing, and referrals.
As this bar chart clearly illustrates, referral programs often outperform other channels in terms of conversion rates. This highlights the power of word-of-mouth marketing and the trust inherent in recommendations from existing customers. The significantly higher conversion rate for referrals emphasizes their potential to drive efficient and cost-effective customer acquisition.
Features and Benefits:
- Indicates the quality of referred leads: A high conversion rate suggests that the leads generated by your referral program are highly qualified and likely to become paying customers.
- Shows product/service resonance: Strong conversion rates indicate that your product or service resonates with the referred audience, validating product-market fit.
- Incentive effectiveness: The conversion rate helps assess whether your referral incentives are attracting the right target audience.
- Segmentation capabilities: Conversion rates can be segmented by referral source or customer segment to identify high-performing advocates and tailor strategies.
Pros:
- Direct indicator of program effectiveness: Provides a clear picture of how well your referral program is contributing to customer acquisition.
- Optimized marketing spend: High conversion rates from referrals can reduce reliance on expensive advertising channels.
- Identifies best referral types: Helps determine which types of referrals convert best, allowing for targeted optimization.
- Cross-channel comparison: Enables comparison with other lead acquisition channels to assess the relative effectiveness of referrals.
Cons:
- Seasonal fluctuations: Conversion rates can be influenced by seasonal factors impacting consumer behavior.
- Tracking complexity: Accurate tracking requires robust attribution mechanisms to correctly attribute conversions to referrals.
- Time lag: Doesn't always account for the time lag between referral and conversion, requiring patience and long-term analysis.
- External factors: Can be affected by external market forces outside the direct control of the referral program.
Examples of Successful Implementation:
- Dropbox leveraged a two-sided incentive program to achieve a 4% referral conversion rate, significantly boosting user growth.
- Airbnb saw referral program conversion rates 300% higher than traditional marketing channels, demonstrating the power of social proof.
- PayPal's referral program boasted conversion rates of 15% during periods of rapid growth, highlighting the impact of network effects.
Tips for Optimizing Referral Conversion Rate:
- Segment and analyze: Track conversion rates by referrer segments to identify your most effective advocates and understand their strategies.
- Accurate attribution: Implement proper attribution tracking to ensure accurate data capture and avoid underestimating referral impact.
- Incentive optimization: Test different incentive structures to find the optimal balance between attracting referrals and maximizing conversion rates.
- Customer journey analysis: Analyze the customer journey of referred leads to identify potential friction points hindering conversions.
This video provides valuable insights into setting up and optimizing a referral program. It covers key strategies for maximizing your referral conversion rate and provides actionable tips for driving growth through referrals.
By focusing on referral conversion rate, early-stage startups, SaaS companies, and indie hackers can effectively leverage the power of word-of-mouth marketing to acquire high-quality customers, reduce acquisition costs, and achieve sustainable growth. This metric is not just a number; it's a vital indicator of the health and effectiveness of your referral program.
2. Participation Rate
Participation Rate is a crucial referral program metric that measures the percentage of your customer base actively engaged in your referral program by making at least one referral. This metric provides valuable insights into how appealing and accessible your program is, effectively gauging its overall effectiveness and identifying areas for improvement. It's calculated by dividing the number of customers who have made at least one referral by your total customer base, then multiplying by 100.

This metric deserves a prominent place in any referral program analysis because it directly reflects program awareness and appeal. It indicates how naturally shareable your product or service is and reveals the effectiveness of your promotional efforts. For early-stage startups, self-serve SaaS companies, product-led growth SaaS, SaaS founders, and indie hackers, understanding participation rate is paramount for leveraging the power of word-of-mouth marketing and driving sustainable growth.
Key features of analyzing Participation Rate include:
- Reflects program awareness and appeal: A low participation rate might suggest that customers aren't aware of the program or don't find it enticing.
- Indicates shareability: High participation often signifies a product or service that customers genuinely enjoy and want to recommend.
- Shows promotional effectiveness: Analyzing participation rates alongside promotional campaigns can highlight which strategies are most successful in driving engagement.
- Helps identify gaps in awareness or usability: Low participation can pinpoint issues with program visibility or difficulties in the referral process itself.
Pros of tracking Participation Rate:
- Highlights opportunities to increase referral volume: By understanding why customers aren't participating, you can develop strategies to boost engagement.
- Identifies untapped potential: Discover segments of your customer base that are more likely to refer and tailor your outreach accordingly.
- Helps gauge program visibility and accessibility: Ensure your program is easy to find and use.
- Can inform improvements to program design and promotion: Use participation data to optimize your program for maximum impact.
Cons of relying solely on Participation Rate:
- High participation doesn't guarantee high-quality referrals: A large number of referrals doesn't necessarily translate to high conversion rates or valuable customers.
- May not distinguish between one-time and repeat referrers: It's important to analyze referral frequency alongside participation rate for a complete picture.
- Can be artificially low if measured across the entire customer base: Consider focusing on active users for a more accurate representation.
- Doesn't account for informal referrals: Some customers might recommend your product organically outside the structured program.
Examples of Successful Implementation:
- Tesla achieved impressive participation rates exceeding 40% among existing customers, demonstrating the power of a well-designed referral program.
- Harry's leveraged pre-launch excitement to achieve a 20% participation rate in their referral campaign, building significant momentum before even launching their product.
- Uber saw participation rates as high as 50% in certain markets during key growth phases, highlighting the impact of referrals on rapid expansion.
Actionable Tips for Improving Participation Rate:
- Maximize visibility: Make your referral program highly visible across all customer touchpoints, including your website, app, and email communications.
- Simplify the process: Reduce friction by making the referral process as quick and easy as possible.
- Targeted reminders: Send personalized emails and in-app messages to remind customers about the program and its benefits.
- Gather feedback: Survey non-participants to understand their reasons for not engaging and address any barriers to participation.
- Incentivize participation: Test different incentives, such as discounts, free products, or exclusive access, to find what resonates best with your audience.
Referral marketing platforms like ReferralCandy and Ambassador, along with growth marketing leaders like Sean Ellis and Andrew Chen, have popularized the importance of tracking and optimizing referral program metrics like Participation Rate. Learn more about Participation Rate and best practices for building a successful referral program. By focusing on increasing participation, you can unlock the full potential of your referral program and drive significant growth for your business.
3. Customer Acquisition Cost (CAC) from Referrals
Customer Acquisition Cost (CAC) from Referrals is a key referral program metric that measures how much it costs your business to acquire a new customer specifically through your referral program. It provides a crucial benchmark for understanding the cost-effectiveness of incentivizing your existing customers to bring in new ones. This metric is calculated by taking the total costs associated with running the referral program (including incentives like discounts or free products, platform fees, and operational costs) and dividing that by the number of new customers acquired through referrals.

This metric is crucial for several reasons. Primarily, it helps you understand the efficiency of your referral program and compare it to other customer acquisition channels. While calculating the Customer Acquisition Cost (CAC) from referrals, it's helpful to compare it to the CAC of other marketing channels. For example, understanding the ROI of traditional marketing campaigns can offer a valuable point of comparison when assessing the effectiveness of your referral program. By analyzing CAC from referrals alongside the costs associated with paid advertising, content marketing, or social media campaigns, you can make informed decisions about resource allocation and optimize your overall marketing strategy. Learn more about Customer Acquisition Cost (CAC) from Referrals.
Features and Benefits:
- Provides cost-efficiency measurement of referral programs: Pinpoint the true cost of acquiring customers through referrals.
- Accounts for all direct and indirect referral program costs: Includes everything from incentive costs to platform fees and program management.
- Enables comparison with other acquisition channels: Determine if referrals are a more cost-effective way to acquire customers compared to paid advertising, content marketing, etc.
- Can be tracked over time to measure program optimization: Monitor CAC trends to understand the impact of program changes and identify areas for improvement.
Pros:
- Typically lower than CAC from paid advertising: Leveraging existing customers often results in a significantly lower acquisition cost.
- Helps justify referral program investment: Provides concrete data to demonstrate the ROI of your referral program.
- Provides data for ROI calculations: Essential for calculating the overall return on investment for your referral program.
- Identifies if referral incentives are appropriately sized: A high CAC from referrals could indicate that your incentives are too generous, while a very low CAC might suggest you could be offering more to boost participation.
Cons:
- Can be challenging to accurately attribute all costs: Some indirect costs, like customer support time related to referred customers, might be harder to quantify.
- May not account for long-term value differences of referred customers: Referred customers often have higher lifetime value, which isn't directly reflected in CAC.
- Doesn't reflect non-monetary benefits like brand advocacy: Referral programs also generate valuable word-of-mouth marketing and brand advocacy, which are difficult to measure financially.
- Can fluctuate based on program maturity and scale: CAC from referrals can be higher in the early stages of a program and stabilize as it matures.
Examples of Successful Implementation:
- Dropbox: Reduced their CAC by 59% through their referral program compared to paid channels.
- Airbnb: Found that customers acquired through referrals cost 25% less than those from other channels.
- PayPal: Achieved a CAC of approximately $1-2 during their rapid growth phase through their referral program.
Tips for Optimizing CAC from Referrals:
- Compare referral CAC with other channels for resource allocation decisions: Shift marketing budget towards the most cost-effective channels.
- Test different incentive structures to optimize CAC: Experiment with different reward types and amounts to find the sweet spot that maximizes referrals while minimizing costs.
- Factor in operational costs like program management and technical implementation: Include these costs in your CAC calculations for a complete picture.
- Track CAC trends over time as your referral program matures: Monitor CAC over time to identify areas for improvement and optimize your program's effectiveness.
- Consider tiered rewards based on the lifetime value potential of different customer segments: Offer higher incentives for referrals from high-value customer segments.
4. Referral Program ROI
Referral Program ROI (Return on Investment) is arguably the most crucial referral program metric for demonstrating the effectiveness and financial viability of your referral initiatives. It provides a holistic view of your program's performance by measuring the revenue generated against the total cost of running the program. This comprehensive metric helps businesses, especially early-stage startups, self-serve SaaS companies, and product-led growth SaaS, determine whether their referral program is a profitable investment and how it stacks up against other marketing channels.
For SaaS founders and indie hackers operating on tight budgets, understanding ROI is paramount. It answers the critical question: "Are we getting more out of our referral program than we're putting in?" Calculating referral program ROI is straightforward:
(Revenue from Referred Customers - Cost of Referral Program) / Cost of Referral Program × 100
This metric can be calculated for different time periods (monthly, quarterly, annually), providing flexibility in assessing program performance. Importantly, it also factors in the long-term value of referred customers, as these customers often demonstrate higher lifetime value (LTV) than those acquired through other channels.
Features and Benefits:
- Holistic Measurement: Provides a complete picture of financial performance, accounting for both costs and revenue.
- Long-Term Vision: Incorporates customer lifetime value (LTV) from referrals for a more accurate assessment of long-term impact.
- Flexible Analysis: Can be calculated across various timeframes, allowing for short-term and long-term evaluation.
- Strategic Justification: Offers concrete data to support program expansion, budget allocation, and executive buy-in.
Examples of Success:
Several companies have demonstrated the immense power of referral programs:
- Koala: This Australian mattress company achieved a staggering 2000% ROI on their referral program.
- Rothy's: The sustainable footwear brand reported a 300% ROI through their friend referral incentives.
- Wise (formerly TransferWise): Their early referral campaigns yielded an impressive 700% ROI.
These examples highlight the potential for significant returns when a referral program is implemented effectively.
Actionable Tips for Optimizing Referral Program ROI:
- Dual ROI Calculation: Track both short-term and projected long-term ROI to understand immediate impact and future growth potential.
- Comprehensive Cost Analysis: Factor in all costs, including referral incentives, technology platforms, and program management overhead.
- Regular Review and Optimization: Conduct quarterly ROI reviews to identify areas for improvement and optimize program performance.
- Segmented Analysis: Compare ROI across different customer segments to uncover high-performing groups and tailor strategies accordingly.
- Incremental ROI Assessment: Before implementing program enhancements, evaluate their potential incremental ROI to ensure efficient resource allocation.
Pros and Cons:
Pros:
- Clear justification for program continuation or expansion.
- Helps optimize program spending for maximum efficiency.
- Provides a comprehensive financial overview beyond just customer acquisition.
- Valuable tool for securing executive buy-in and budget approvals.
Cons:
- Requires accurate attribution of customer revenue to the referral program.
- May not capture the full value if the customer LTV period extends beyond the measurement window.
- Doesn't account for non-financial benefits like increased brand advocacy and word-of-mouth marketing.
- Can be affected by the time lag between referral costs and revenue realization.
Why Referral Program ROI Matters:
For early-stage startups and SaaS companies aiming for sustainable growth, referral program ROI offers a crucial benchmark for success. It allows you to measure the effectiveness of your referral efforts, optimize spending, and demonstrate the value of the program to stakeholders. Learn more about Referral Program ROI. By focusing on this key metric, you can unlock the full potential of your referral program and drive significant growth for your business.
5. Average Number of Referrals per Customer
This crucial referral program metric, the average number of referrals per customer, measures how many referrals each participating customer makes on average. It provides valuable insight into the enthusiasm your customers have for your product or service and how effectively your referral program incentivizes them to spread the word. This metric is calculated by dividing the total number of referrals by the number of customers who have made at least one referral. Understanding this metric is critical for early-stage startups, self-serve SaaS companies, product-led growth SaaS, SaaS founders, and indie hackers looking to leverage the power of word-of-mouth marketing.
This metric deserves its place on the list of essential referral program metrics because it gives you a clear picture of your program's viral potential and the effectiveness of your incentives. It goes beyond simply counting total referrals and dives into the behavior of your referring customers.
Features and Benefits:
- Indicates program virality potential: A high average referral rate suggests strong word-of-mouth potential and a product-market fit that resonates with your target audience.
- Shows effectiveness of incentives for multiple referrals: A low average may indicate a need to adjust your incentive structure to encourage more referrals per customer.
- Can reveal customer enthusiasm level: A high average often reflects a high level of customer satisfaction and brand advocacy.
- Helps identify super-referrers in your customer base: Pinpointing those customers who consistently make a high number of referrals can unlock valuable insights for future marketing strategies.
Pros:
- Identifies opportunities to increase referral volume: By understanding the average, you can strategize on how to encourage more referrals from your existing customer base.
- Helps optimize incentive structures for repeat referrers: Tiered rewards and other incentives can be designed to specifically target and reward highly active referrers.
- Can inform segmentation strategies for high-value referrers: You can tailor your communication and offers to different customer segments based on their referral behavior.
- More stable than absolute referral counts as customer base grows: Provides a normalized view of referral activity regardless of fluctuations in your overall customer base.
Cons:
- Can be skewed by a small number of highly active referrers: A few super-referrers can inflate the average, masking potential issues with the broader customer base's engagement.
- Doesn't account for referral quality or conversion rates: A high average doesn't guarantee high-quality leads or conversions.
- May decrease naturally as program matures: As your program grows, the average may decrease as you reach a wider range of customer engagement levels.
- Difficult to benchmark across industries: Average referral rates can vary significantly based on industry, product type, and customer demographics.
Examples of Successful Implementation:
- Robinhood: Achieved an average of 5 referrals per user during their waitlist campaign, demonstrating the power of exclusivity and anticipation.
- Evernote: Their referral program generated an average of 3.2 referrals per active referrer, highlighting the effectiveness of a valuable product and a well-structured program.
- Morning Brew newsletter: Saw premium subscribers refer an average of 4.6 friends, showcasing the impact of community and valuable content.
Actionable Tips:
- Implement tiered rewards: Offer increasingly attractive incentives for customers who make multiple referrals.
- Create a leaderboard: Gamify the referral process by showcasing top referrers and fostering healthy competition.
- Analyze the distribution of referrals: Identify and learn from super-referrers to understand their motivations and strategies.
- Set different goals for different customer segments: Tailor your referral targets based on customer demographics and engagement levels.
- Make the referral status and history easily visible to customers: Provide clear visibility into their referral activity to encourage continued participation.
When and Why to Use This Approach:
Tracking the average number of referrals per customer is essential throughout the lifecycle of your referral program. From the initial launch to ongoing optimization, it provides a valuable benchmark for measuring success and identifying areas for improvement. This metric is particularly important for businesses focused on viral growth and leveraging the power of their existing customer base. By understanding and actively managing this metric, you can unlock the full potential of your referral program and drive sustainable growth.
6. Referred Customer Lifetime Value (LTV)
Referred Customer Lifetime Value (LTV) is a critical referral program metric for any business, particularly early-stage startups, self-serve SaaS companies, and product-led growth SaaS, looking to maximize the impact of their referral programs. It measures the total revenue a business can expect from a customer acquired through a referral, throughout their entire relationship with the company. Understanding this metric helps you determine the true value of referred customers and optimize your referral program for maximum ROI. This is a key metric for SaaS founders and indie hackers focused on sustainable growth.
How it Works:
Referred Customer LTV goes beyond simply tracking the initial purchase made by a referred customer. It accounts for the long-term value they bring, considering factors like:
- Purchase Frequency: How often do referred customers make purchases compared to customers acquired through other channels?
- Average Order Value (AOV): Do referred customers spend more per purchase?
- Customer Lifespan: Do referred customers stay with your company longer?
By analyzing these factors, you can calculate the overall revenue generated by a referred customer over their entire relationship with your business.
Why Referred Customer LTV Matters:
This metric deserves its place on the list of essential referral program metrics because it provides crucial insights into the effectiveness and profitability of your referral program. It helps you answer key questions like:
- Are referred customers more valuable than those acquired through other marketing channels (e.g., paid ads, organic search)?
- What is the return on investment (ROI) of your referral program?
- What is the appropriate incentive level to offer referrers and referred customers?
Features and Benefits:
- Compares Referred vs. Non-Referred Customers: Directly compare the LTV of customers from different acquisition sources to understand the true value of referrals.
- Informs Incentive Optimization: Helps determine appropriate referral incentive levels that maximize ROI without overspending.
- Justifies Program Investment: Provides concrete data to demonstrate the financial impact of your referral program and justify continued investment.
- Segmentation Capabilities: Allows for segmentation by referrer type or customer category to identify high-value segments and tailor your referral program accordingly.
Examples of Successful Implementation:
- Stitch Fix: Found that referred customers spent 27% more in their first 12 months than customers acquired through other channels.
- Uber: Discovered that referred drivers stayed with the platform 20% longer than non-referred drivers, significantly increasing their LTV.
- Bank of America: Observed that referred checking account customers were 18% less likely to churn and generated 16% more revenue.
Pros:
- Higher Customer Value: Often reveals that referred customers have higher LTV than those from other acquisition sources.
- ROI Justification: Provides strong justification for investment in referral programs.
- Optimized Incentives: Facilitates data-driven decisions about referral incentives.
- Long-Term Impact Measurement: Demonstrates the full financial impact of referral programs beyond the initial acquisition.
Cons:
- Data Dependence: Requires significant historical data for accurate calculation.
- Time Investment: May take time to fully realize and measure LTV.
- Segment Variability: Can vary significantly across different customer segments.
- Projection Adjustments: Requires regular adjustment of projections as customer behavior changes.
Actionable Tips:
- Benchmark Against Other Channels: Compare the LTV of referred customers to customers acquired through other channels (e.g., paid advertising, organic search).
- Segment for High-Value Customers: Create different referral incentive structures for high-LTV customer segments.
- Track Trends: Monitor changes in referred customer LTV over time to identify trends and optimize your program.
- Set Incentive Limits: Use predicted LTV to set maximum allowable referral incentives.
- Consider Vesting Periods: For businesses with longer sales cycles, consider longer reward vesting periods to align with revenue realization.
By focusing on Referred Customer LTV, you can transform your referral program from a simple growth tactic into a powerful engine for sustainable, profitable growth. This metric is invaluable for understanding the true impact of referrals on your business and optimizing your strategy accordingly.
7. Net Promoter Score (NPS) Correlation
Net Promoter Score (NPS) Correlation is a crucial referral program metric that examines the relationship between a customer's likelihood to recommend your business (their NPS rating) and their actual referral behavior. This metric helps bridge the gap between stated intentions and real-world actions, revealing whether satisfied customers truly translate their positive sentiment into valuable referrals. For early-stage startups, self-serve SaaS companies, and product-led growth SaaS, understanding this correlation can unlock significant growth potential by leveraging existing satisfied customers.
How it Works:
NPS Correlation is calculated by analyzing the referral activity of customers segmented by their NPS responses (Detractors, Passives, and Promoters). By tracking how often customers in each NPS segment participate in your referral program, you can identify strong correlations between satisfaction levels and referral behavior. This analysis can pinpoint your most enthusiastic advocates and highlight potential roadblocks preventing satisfied customers from referring.
Examples of Successful Implementation:
Several companies have demonstrated the power of NPS correlation in their referral programs:
- Slack: Found that customers who gave 9-10 NPS scores (Promoters) were 4x more likely to participate in their referral program. This highlights the strong correlation between high satisfaction and referral likelihood.
- Wealthfront: Discovered that 68% of their referrals came from customers with NPS scores of 9-10. This example underscores the significant contribution of Promoters to referral program success.
- Chewy.com: Identified that NPS Promoters generated 45% of their referral program participants. This showcases how focusing on highly satisfied customers can significantly boost referral program engagement.
Actionable Tips for SaaS Founders and Indie Hackers:
- Segment Your Communications: Tailor your referral program messaging based on NPS scores. Target Promoters with exclusive offers and personalized invitations.
- Create Special Opportunities for High-NPS Customers: Reward your most loyal advocates with premium incentives or early access to new features in exchange for referrals.
- Investigate Low Referral Rates Among Promoters: If high-NPS customers aren't referring, dig deeper to understand why. Survey them, analyze their behavior, and identify potential program barriers.
- Leverage NPS Survey Follow-ups: Use NPS surveys as an opportunity to introduce your referral program to Promoters immediately after they express their satisfaction.
- Study Passive Supporters: Analyze the behavior of Promoters who don't refer to identify potential friction points in your referral process.
When and Why to Use This Approach:
NPS Correlation is particularly valuable for:
- Validating NPS Predictive Value: Determine if your NPS scores accurately reflect referral potential.
- Identifying Target Segments: Pinpoint which customer segments are most likely to participate in your referral program and focus your efforts accordingly.
- Converting Passive Supporters: Identify strategies to nudge passive supporters (those who score 7-8) into becoming active referrers.
- Evaluating NPS Effectiveness: Gain another dimension for understanding the impact and effectiveness of your NPS program.
Pros:
- Validates the predictive value of NPS for referral potential.
- Helps identify which customer segments to target for referral program participation.
- Reveals opportunities to convert passive supporters into active referrers.
- Provides another dimension for evaluating NPS effectiveness.
Cons:
- Correlation doesn't always equal causation. Other factors may influence referral behavior.
- Requires sophisticated data integration between NPS and referral systems.
- Can be influenced by factors outside the referral program (like ease of sharing or product virality).
- Cultural factors can affect both NPS responses and referral behaviors.
This metric deserves a place on this list because it provides a powerful link between customer satisfaction and a key growth driver: referrals. For startups and SaaS companies, especially those focused on product-led growth, understanding this connection is essential for optimizing referral program performance and maximizing organic growth. By analyzing NPS Correlation, you can fine-tune your referral strategy, target the right customers, and unlock the full potential of your most enthusiastic advocates.
Referral Program Metrics Overview
| Metric | 🔄 Implementation Complexity | 💡 Key Insights / Tips | ⚡ Resource Requirements | ⭐ Expected Outcomes / Quality | 📊 Ideal Use Cases |
|---|---|---|---|---|---|
| Referral Conversion Rate | Medium - requires tracking and attribution systems | Track by referrer segments; test incentives; analyze funnel | Moderate - tracking tools, analytics | High - directly measures referral effectiveness | Evaluating referral program efficiency |
| Participation Rate | Low to Medium - simpler data collection | Simplify process; increase visibility; survey non-participants | Low - basic tracking and surveys | Medium - shows program appeal but not quality | Increasing referral volume and engagement |
| Customer Acquisition Cost (CAC) from Referrals | Medium - requires cost aggregation and attribution | Compare CAC across channels; track over time; factor operational costs | Moderate - financial tracking and reporting | High - measures cost-efficiency of acquisition | Budget optimization and channel comparison |
| Referral Program ROI | High - needs revenue and cost data integration | Calculate short and long-term ROI; review quarterly; segment analysis | High - sales data, cost reports, analytics | Very High - comprehensive financial performance | Justifying and scaling referral investments |
| Average Number of Referrals per Customer | Low - straightforward calculation | Use tiered rewards and gamification; identify super-referrers | Low - data on referrals per active customer | Medium - indicates virality potential | Motivating repeat referrals and segmentation |
| Referred Customer Lifetime Value (LTV) | High - requires longitudinal revenue tracking | Segment by customer type; compare to non-referred; track trends | High - deep analytics and historical data | Very High - measures long-term customer value | Optimizing incentives; understanding customer worth |
| Net Promoter Score (NPS) Correlation | High - needs integrated NPS and referral data | Target high-NPS customers; investigate non-referring promoters | High - combined NPS surveys and referral tracking | Medium to High - links satisfaction to referrals | Enhancing referral targeting and program design |
Maximize Your Growth with Refgrow: The All-in-One Referral Program Solution
Mastering your referral program metrics is the key to unlocking sustainable, exponential growth. Throughout this article, we've explored seven crucial metrics—from referral conversion rate and participation rate to customer acquisition cost (CAC) and the impact of referrals on customer lifetime value (LTV). By carefully monitoring these referral program metrics, you gain invaluable insights into your program's performance, identify areas for improvement, and ultimately, drive more high-quality leads through the power of word-of-mouth marketing. Understanding the correlation between metrics like Net Promoter Score (NPS) and referral program success allows you to pinpoint the drivers of advocacy within your existing customer base. This knowledge translates directly to a more effective referral program and a healthier bottom line. For early-stage startups, self-serve SaaS companies, and product-led growth SaaS, optimizing these metrics can be the difference between steady growth and explosive scaling.
Building a successful referral program, however, requires more than just understanding these metrics; it requires the right tools. Managing referral links, tracking conversions, calculating ROI, and automating reward payouts can quickly become overwhelming. Refgrow simplifies all of this. As a fully embeddable affiliate software, Refgrow empowers you to seamlessly track, analyze, and optimize your key referral program metrics all within a single platform. Stop juggling spreadsheets and struggling with disjointed tools.
Ready to take your referral program to the next level and unlock the true potential of referral marketing? Explore how Refgrow can help you track, analyze, and optimize your referral program metrics for maximized growth. Visit Refgrow today to learn more and request a demo.