7 Product Led Growth Metrics to Track in 2025

Unlocking Growth: The Power of Product-Led Metrics
Want to drive sustainable growth for your SaaS product? This listicle reveals seven crucial product-led growth metrics you need to track in 2025. Learn how monitoring metrics like Product Qualified Leads (PQLs), Time to Value (TTV), and Product Adoption Rate can unlock product virality, maximize user engagement, and boost your bottom line. Whether you're an early-stage startup or an established SaaS business, understanding these product-led growth metrics is key to optimizing your product and achieving sustainable growth. Let's get started.
1. Product Qualified Leads (PQLs)
Product Qualified Leads (PQLs) are the cornerstone of a successful product-led growth (PLG) strategy. They represent prospects who have not only shown interest in your product but have also demonstrated a strong likelihood of converting into paying customers by actively using and experiencing its core value. This distinguishes PQLs from traditional Marketing Qualified Leads (MQLs), which are typically qualified based on demographic data or content engagement, rather than actual product usage. In the world of product-led growth metrics, PQLs offer a far more accurate and effective way to identify your most promising prospects. PQLs represent users who have experienced the “aha moment” within your product, signifying they’ve realized its value and are more likely to convert to paying customers.

How do PQLs work? It's all about tracking and analyzing in-app behavior. By defining specific actions within your product that correlate with future conversions – your "aha moments" – you can identify users demonstrating genuine interest and potential. These actions could range from creating multiple projects in a project management tool to inviting team members in a communication platform or regularly using a key feature in your SaaS application. By implementing product usage tracking and scoring mechanisms, you can assign values to these key actions, creating a PQL score that reflects the user's engagement level and potential to convert. This allows you to prioritize high-scoring PQLs and focus your sales and marketing efforts on the most promising leads.
Several successful companies have leveraged PQLs to drive impressive growth. Slack, for instance, identifies PQLs as users who create multiple channels and invite team members, indicating they're actively building a collaborative workspace. Calendly tracks users who schedule a certain number of meetings, demonstrating a reliance on the platform for scheduling needs. Zoom flags users who host meetings with multiple participants, highlighting their need for video conferencing solutions. And HubSpot scores leads who create contacts and send emails through their CRM, showcasing their active use of the platform for marketing automation.
For early-stage startups, self-serve SaaS companies, and indie hackers, incorporating PQLs into your growth strategy offers several compelling advantages:
Pros:
- Higher conversion rates: PQLs, having already experienced the product's value, are significantly more likely to convert than MQLs.
- More accurate purchase intent prediction: Product usage is a strong indicator of genuine interest and buying intent.
- Reduced sales cycle length: By focusing on high-intent users, you can accelerate the sales process.
- Improved alignment between marketing and product teams: A shared focus on PQLs fosters better collaboration and communication.
- Increased sales efficiency: Sales teams can prioritize highly qualified leads, optimizing their time and resources.
Cons:
- Requires a robust product analytics setup: Tracking and analyzing user behavior requires sophisticated tools and infrastructure.
- Potential to miss early-stage prospects: Focusing solely on deep engagement might overlook users who haven't fully explored the product yet.
- Ongoing refinement of scoring criteria: PQL scoring models require continuous adjustments based on data and user behavior.
- Complexity in implementation across multiple product touchpoints: Integrating PQL tracking across various product interfaces can be challenging.
To effectively implement a PQL-driven strategy, consider these actionable tips:
- Define clear "aha moments": Identify the key in-app actions that correlate with conversion to paying customers.
- Start simple and iterate: Begin with a basic set of criteria and refine your scoring model based on data analysis.
- Collaborate with sales: Align PQL definitions with your sales team's input to ensure a shared understanding of qualified leads.
- Track time-to-PQL: Monitor the time it takes for users to reach PQL status to optimize your onboarding process.
- Use progressive scoring: Implement a gradual scoring system rather than a binary qualification approach.
PQLs offer a powerful framework for product-led growth, enabling you to identify, nurture, and convert your most promising prospects. By focusing on in-app behavior and aligning your sales and marketing efforts around product usage, you can significantly improve your conversion rates, shorten your sales cycle, and drive sustainable growth for your SaaS business. Popularized by companies like OpenView Partners, Slack, Dropbox, and Atlassian, the PQL methodology is a critical metric for understanding and optimizing product-led growth.
2. Time to Value (TTV)
Time to Value (TTV) is a crucial product-led growth metric that measures how quickly new users experience the core value proposition of your product. This "aha moment" represents the point where users understand the benefits and are likely to continue engaging. For product-led growth companies, minimizing TTV is essential for driving user activation, reducing early-stage churn, and ultimately, fueling sustainable growth. It's a critical factor in determining whether a user will stick around or abandon your product, especially for self-serve SaaS businesses where users have the freedom to churn quickly. A high TTV often indicates friction in the onboarding process and suggests areas for improvement in user experience.

TTV isn’t simply about speed; it’s about effectively guiding users to the core value your product offers. This involves tracking user progression through the initial onboarding experience and identifying any bottlenecks hindering their journey to that "aha moment." By understanding how users interact with your product, you can pinpoint areas of friction and optimize the onboarding flow to accelerate the time to value. This, in turn, directly impacts key product-led growth metrics like user activation and long-term retention. For example, a SaaS company might track the time it takes a user to create their first project, invite a team member, or generate a report – actions that demonstrate the core value of their platform.
Successful implementations of TTV optimization are abundant in the product-led growth space. Facebook's famed "7 friends in 10 days" strategy, while seemingly simple, is a prime example of defining a key activation metric that correlates with long-term user retention. Similarly, Slack measures the time it takes for users to participate in their first team conversation, recognizing that collaboration is the core value proposition of their platform. Canva's focus on the time to first design creation and share, and Notion’s measurement of time to create a first collaborative workspace, further demonstrate the importance of aligning TTV with core product functionality. These companies recognize that a user experiencing value quickly is more likely to become a long-term customer.
While the benefits of optimizing TTV are substantial, it's important to acknowledge the challenges. Defining “value” can be subjective and vary significantly across different user segments or use cases. What one user considers valuable might differ from another’s experience, requiring careful consideration of user personas and their specific needs. External factors, such as internet connectivity or prior experience with similar products, can also influence TTV, making it a metric that requires ongoing monitoring and analysis.
For early-stage startups, self-serve SaaS companies, and indie hackers, optimizing TTV is particularly crucial. It's a key lever for driving organic growth and minimizing customer acquisition costs. By focusing on delivering value quickly, these businesses can build a loyal user base and establish a strong foundation for sustainable growth.
Here are some actionable tips for improving your TTV:
- Map the user journey: Clearly define the steps a user takes from signup to their first "aha moment." This will help you identify potential friction points and areas for optimization.
- Reduce friction in onboarding: Streamline the onboarding process by minimizing unnecessary steps and providing clear, contextual guidance.
- Segment TTV by user persona: Analyze TTV data for different user segments to gain more granular insights and tailor the onboarding experience accordingly.
- Continuously test and optimize: Regularly A/B test different onboarding flows to identify the most effective strategies for reducing TTV.
- Prioritize user feedback: Collect feedback from users about their onboarding experience to identify areas for improvement.
By meticulously tracking and optimizing TTV, companies can ensure users quickly realize the value of their product, leading to increased activation, improved retention, and ultimately, sustainable product-led growth. Learn more about Time to Value (TTV) This focus on user experience is fundamental to the success of any product-led growth strategy. Understanding and improving TTV is not just about optimizing a metric; it’s about building a product that users love and rely on.
3. Product Adoption Rate
Product Adoption Rate is a crucial product-led growth metric that measures the percentage of users actively engaging with key features or achieving predefined usage milestones within a specific timeframe. It moves beyond simple sign-ups and delves into how well users are experiencing and utilizing the core value propositions of your product. Tracking Product Adoption Rate is essential for understanding user behavior, identifying successful features, and ultimately, driving product-led growth. For early-stage startups, self-serve SaaS companies, and indie hackers, this metric is a powerful tool for validating product-market fit and prioritizing development efforts.
Instead of simply counting registered users, Product Adoption Rate focuses on active usage. This allows you to pinpoint the features that resonate with your audience and identify areas where users might be struggling. By understanding which features are adopted quickly and which are lagging, you can gain valuable insights into how well your product meets user needs and what improvements or adjustments might be necessary.
This metric provides a nuanced understanding of user engagement. It allows you to segment adoption rates by different user cohorts, such as free trial users versus paid subscribers, or by specific user personas. This granularity allows for more targeted interventions, like personalized onboarding flows or in-app guidance, leading to improved user experience and higher conversion rates. Imagine, for instance, that your data reveals a low adoption rate for a key feature amongst new users. This insight could prompt the creation of an interactive tutorial specifically designed to highlight the value and functionality of that feature during the onboarding process.
One of the most powerful aspects of Product Adoption Rate is its ability to measure both the breadth and depth of feature adoption. Breadth refers to how many features a user engages with, while depth refers to how intensively they use specific features. For example, a project management tool might track the breadth of adoption by measuring how many different features (task creation, file sharing, calendar integration) users access. Depth, on the other hand, could be measured by tracking how frequently users create tasks or how many files they share.
Examples of Successful Implementation:
- Spotify: Analyzing playlist creation and sharing rates provides insights into user engagement with core social features, helping Spotify tailor recommendations and social interactions.
- Adobe Creative Cloud: Tracking advanced tool usage within specific applications, like Photoshop or Illustrator, helps Adobe understand how users are leveraging the full potential of their software suite.
- Salesforce: Monitoring custom field and automation adoption allows Salesforce to identify power users and understand how businesses are tailoring the platform to their unique workflows.
- Zoom: Measuring breakout room and recording feature usage helps Zoom understand how users are leveraging the platform for different types of meetings and collaborations.
Actionable Tips for Tracking Product Adoption Rate:
- Define clear adoption criteria: Focus on meaningful user actions that demonstrate genuine engagement with a feature, not just superficial interaction.
- Track both breadth and depth: Understanding both aspects provides a more complete picture of user behavior and feature usage.
- Segment by user persona and use case: Identify patterns and tailor onboarding experiences to specific user needs.
- Focus on features that correlate with retention: Prioritize improving the adoption of features that contribute to long-term customer success.
- Use progressive disclosure to improve adoption rates: Gradually introduce new features to avoid overwhelming users and encourage deeper engagement.
Pros and Cons of Using Product Adoption Rate:
Pros:
- Identifies successful and struggling features
- Helps prioritize product development efforts
- Indicates product-market fit strength
- Enables targeted user education and support
- Correlates with long-term customer success
Cons:
- May not reflect the quality of usage
- Can be misleading if adoption criteria are poorly defined
- Doesn't account for user intent or need
- May encourage feature bloat if misinterpreted
Learn more about Product Adoption Rate as it relates to customer retention strategies. Understanding how adoption influences retention can significantly impact your product’s long-term success.
By incorporating Product Adoption Rate into your product-led growth strategy, you gain a powerful lens through which to view user behavior. This data-driven approach enables informed decisions about feature development, user onboarding, and overall product strategy, ultimately fueling growth and enhancing user satisfaction. For SaaS founders and indie hackers, leveraging this metric is key to building a product that truly resonates with users and drives sustainable growth. Popular analytics platforms like Amplitude, Mixpanel, Pendo, and Gainsight offer robust tools for tracking and analyzing product adoption.
4. Net Promoter Score (NPS)
Net Promoter Score (NPS) is a crucial product-led growth metric that gauges customer loyalty and their willingness to recommend your product. In the product-led growth model, where user experience and organic adoption are paramount, NPS serves as a powerful leading indicator of growth potential. By understanding how likely your customers are to recommend your product, you gain invaluable insights into their overall satisfaction and the likelihood of organic, word-of-mouth referrals driving viral adoption. This makes NPS an essential tool for early-stage startups, self-serve SaaS companies, product-led growth SaaS businesses, SaaS founders, and indie hackers alike.
NPS is determined through a simple, single-question survey: "On a scale of 0 to 10, how likely are you to recommend [your product] to a friend or colleague?" Based on their responses, customers are categorized into three groups:
- Promoters (9-10): These are your most enthusiastic customers, acting as brand advocates and driving organic growth through referrals.
- Passives (7-8): Satisfied but not necessarily loyal, passives are susceptible to competitive offerings and less likely to actively promote your product.
- Detractors (0-6): Unhappy customers who may churn and potentially damage your brand reputation through negative word-of-mouth.
Your NPS is calculated by subtracting the percentage of Detractors from the percentage of Promoters. A positive NPS is generally considered good, while a score above 50 is excellent, indicating a high level of customer loyalty. Benchmarking your NPS against competitors within your industry provides a valuable context for evaluating your performance.
Why NPS Matters for Product-Led Growth
In the product-led growth paradigm, the product itself is the primary driver of acquisition, conversion, and retention. A high NPS signifies a product that resonates with users, leading to increased organic growth through:
- Word-of-mouth referrals: Promoters are more likely to recommend your product to their networks, driving organic user acquisition.
- Viral adoption: Positive user experiences fuel organic growth and can lead to viral adoption, especially within specific communities or niches.
- Reduced churn: Loyal customers (Promoters) are less likely to churn, contributing to higher customer lifetime value.
- Increased customer acquisition cost (CAC) efficiency: Organic growth driven by NPS reduces reliance on paid acquisition channels, lowering CAC.
Features and Benefits of Using NPS:
NPS boasts several features that make it particularly useful for product-led growth: its simple single-question survey format allows for high response rates; the clear categorization of users into Promoters, Passives, and Detractors simplifies analysis; the ability to trigger surveys based on product usage milestones allows for timely feedback collection; and the option to incorporate qualitative feedback provides deeper insights into user sentiment. Furthermore, tracking NPS changes over time helps monitor the impact of product updates and marketing initiatives. This makes it easy to understand, implement, and track consistently, offering a strong predictor of organic growth and referrals, correlating with revenue growth and retention, and identifying potential customer advocates.
Examples of Successful NPS Implementation:
Several companies have effectively leveraged NPS to drive product-led growth:
- Tesla: Known for its innovative products and high customer satisfaction, Tesla consistently achieves industry-leading NPS scores, demonstrating the strong correlation between product excellence and customer loyalty.
- Apple: By cultivating a seamless and integrated ecosystem experience, Apple maintains a high NPS, reinforcing the importance of a cohesive product strategy.
- Zoom: Zoom's NPS surged during the pandemic, highlighting the impact of product reliability and ease of use on customer satisfaction and subsequent growth.
- Netflix: Netflix utilizes NPS to inform content and platform decisions, demonstrating the value of incorporating customer feedback into product development.
Tips for Effectively Utilizing NPS:
To maximize the value of NPS in your product-led growth strategy, consider the following tips:
- Survey users after positive product experiences: Triggering surveys after key milestones, such as successful onboarding or completion of a core task, increases the likelihood of positive feedback.
- Follow up with promoters for testimonials and referrals: Leverage the enthusiasm of your promoters by requesting testimonials and encouraging referrals.
- Analyze detractor feedback for product improvement insights: Detractor feedback provides valuable insights into areas for product improvement and can help identify potential churn risks.
- Segment NPS by user persona and product usage patterns: Segmenting NPS data allows you to identify specific areas for improvement and tailor your product strategy to different user groups.
- Combine with other product-led growth metrics for a comprehensive understanding: NPS provides a valuable perspective on customer loyalty but should be used in conjunction with other metrics like customer churn rate, customer lifetime value, and product usage data for a holistic view of your product's performance.
While NPS is a powerful metric, it does have limitations. It can be influenced by recent experiences or emotions and may not capture nuanced feedback. Cultural differences can also affect scoring patterns. Additionally, NPS doesn't provide specific actionable insights on its own and can suffer from response bias. However, by understanding these limitations and using NPS strategically alongside other product-led growth metrics, you can gain invaluable insights into customer loyalty and drive sustainable organic growth.
5. Daily/Monthly Active Users (DAU/MAU)
Daily Active Users (DAU) and Monthly Active Users (MAU) are two cornerstone metrics in product-led growth (PLG). They provide a fundamental understanding of how many unique users engage with your product on a daily and monthly basis, respectively. While individually they offer valuable insights, the real power lies in their relationship – the DAU/MAU ratio, often referred to as "stickiness." This ratio reveals how frequently users return to your product, a critical indicator of product engagement and long-term viability for any product-led growth strategy. For early-stage startups, self-serve SaaS companies, and indie hackers, DAU/MAU acts as a pulse check on the health of your product and its potential for sustainable growth.
DAU/MAU measures consistent product engagement, tracking user activity patterns and trends, which enables cohort analysis and segmentation. This allows you to understand the behaviors of specific user groups. By defining "active" based on meaningful actions within your product (e.g., completing a core task, creating content, or interacting with a key feature), you gain valuable insights into how users are deriving value. This information is incredibly powerful for SaaS founders looking to optimize their product for increased user engagement and, ultimately, revenue.
One of the biggest advantages of tracking DAU/MAU is the ability to identify usage patterns and trends early on. This enables the early detection of potential engagement issues, allowing you to proactively address them before they escalate. For example, a sudden drop in DAU could indicate a bug, a poorly received feature update, or even a shift in user behavior. This early warning system can be crucial for maintaining a healthy product and retaining users. Furthermore, understanding your DAU/MAU helps with capacity planning and resource allocation. Predicting usage patterns enables you to scale your infrastructure and support teams effectively, ensuring a smooth user experience even during periods of rapid growth.
However, DAU/MAU isn't without its limitations. It doesn't measure the quality or depth of engagement. A user might log in daily to quickly check notifications without actually using core features. This can be artificially inflated by push notifications or other engagement tactics, leading to a misleadingly high DAU. The metric also doesn't necessarily reflect true value creation for users. Someone might be actively using your product but not finding the value they need, leading to eventual churn. Finally, defining "active" can be subjective and seasonal variations can skew the interpretation of the data.
Despite these drawbacks, DAU/MAU remains a powerful metric when used correctly. Successful implementation can be seen across many leading platforms. Facebook, for instance, maintains a high DAU/MAU ratio (around 66%), indicating impressive stickiness and habitual usage. Slack achieves high enterprise DAU through its team-based workflows, demonstrating the power of collaboration in driving daily engagement. Instagram leverages features like Stories and social interactions to encourage daily use, while Notion has grown its MAU through viral workspace sharing and templates.
To effectively utilize DAU/MAU in your product-led growth strategy, consider the following tips:
- Define "active" based on meaningful value-creating actions: Don't just measure logins. Focus on actions that demonstrate real engagement and value realization.
- Track the DAU/MAU ratio as a stickiness indicator: A higher ratio generally suggests stronger product engagement and habit formation.
- Segment by user type and acquisition channel: Understand the behavior of different user segments to tailor your product and marketing efforts effectively.
- Monitor trends rather than absolute numbers: Look for changes in DAU/MAU over time to identify potential issues or opportunities.
- Combine with engagement depth metrics for a fuller picture: Supplement DAU/MAU with other metrics like time spent in-app, feature usage, and customer satisfaction to gain a deeper understanding of user behavior.
The infographic below visualizes DAU/MAU data for a hypothetical SaaS product, comparing DAU, MAU, and the calculated stickiness percentage. This is presented as a bar chart with clearly labeled axes and a distinct color highlighting the stickiness percentage.
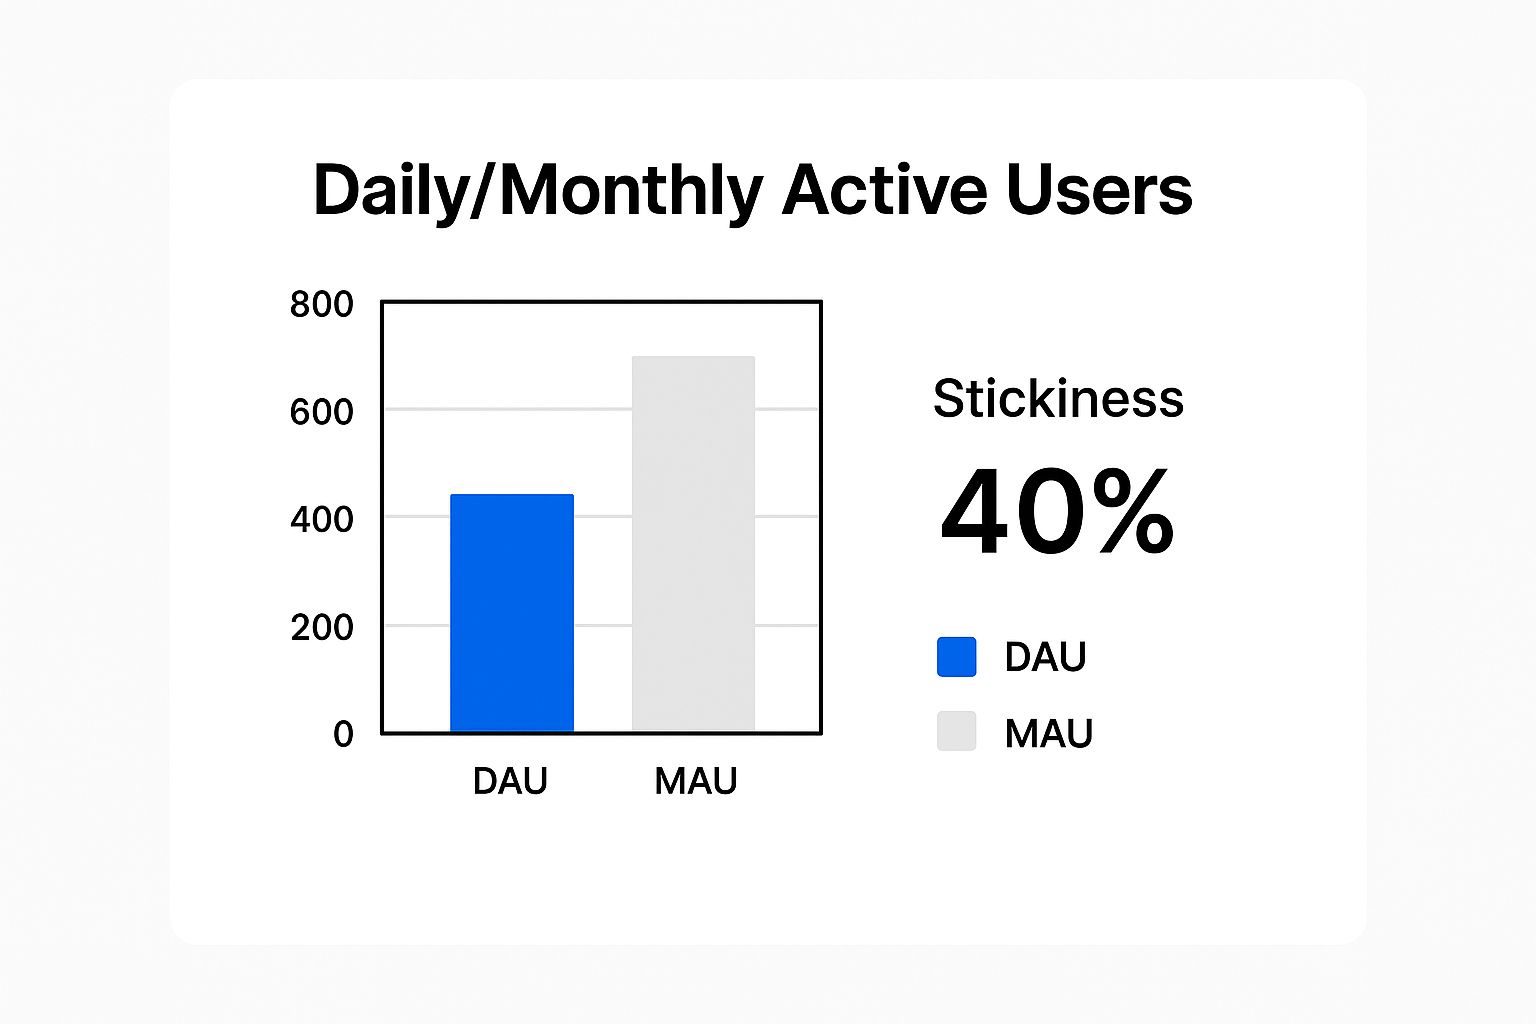
As the infographic shows, the product has a DAU of 5,000 and an MAU of 10,000, resulting in a stickiness of 50%. This indicates that, on average, half of the monthly active users engage with the product daily. While not as high as Facebook's benchmark, this stickiness percentage suggests a healthy level of engagement for a hypothetical SaaS product and provides a solid foundation for further growth. By consistently monitoring and analyzing DAU/MAU, you can gain invaluable insights into your product's health, identify areas for improvement, and drive sustainable product-led growth.
6. Feature Adoption Rate
Feature Adoption Rate is a critical product-led growth metric that measures the percentage of your user base actively using specific product features within a defined timeframe. Understanding this metric allows product teams to gauge the success of new features, identify opportunities for improvement in onboarding and feature discovery, and ultimately, drive product-led growth by focusing on the features that deliver real value to users. For early-stage startups, self-serve SaaS companies, and indie hackers, tracking feature adoption is crucial for iterating quickly and building a product that resonates with the target audience.
This metric goes beyond simply counting the number of users with access to a feature. It focuses on actual usage, providing insights into how well features are integrated into users' workflows. This is especially important for product-led growth SaaS businesses where the product itself is the primary driver of acquisition, conversion, and expansion. By understanding which features are adopted quickly and which struggle to gain traction, you can make data-driven decisions about product development priorities, marketing campaigns, and even pricing strategies.
How Feature Adoption Rate Works:
Tracking feature adoption rate requires a robust analytics implementation. You'll need to instrument your product to capture events related to specific feature usage. This typically involves integrating analytics tools like Amplitude, Pendo, Mixpanel, or Hotjar, which allow you to segment users, track events, and visualize adoption trends. Once implemented, you can track individual feature usage across your entire user base, measure the speed of adoption (adoption velocity), and identify the point at which adoption plateaus (saturation).
Examples of Successful Implementation:
Several successful SaaS companies leverage feature adoption rate to guide their product strategy. Slack, for example, tracks the adoption of features like threads, huddles, and workflow automation to understand how users are collaborating and identify areas for improvement. Figma, a collaborative design tool, measures the adoption of real-time editing and commenting features to understand how users are collaborating on designs. Spotify analyzes playlist creation, music discovery features, and podcast adoption to personalize user experiences and drive engagement. Asana uses feature adoption data to understand how teams are leveraging project templates, custom fields, and automation features to optimize workflows.
Actionable Tips for Tracking Feature Adoption Rate:
- Focus on Key Features: Prioritize tracking features that directly correlate with user retention and expansion revenue. These are the features that drive core value and contribute most significantly to your product-led growth strategy.
- Improve Feature Discoverability: Use progressive disclosure to introduce new features gradually, preventing users from feeling overwhelmed and improving the likelihood of adoption.
- Segment Your Users: Analyze adoption rates by user persona, tenure, and other relevant segments to understand how different user groups interact with your product. This granular view can uncover valuable insights for targeted onboarding and feature education.
- Contextual Prompts and Tutorials: Implement contextual feature prompts and in-app tutorials to guide users towards valuable features they may not have discovered on their own. This proactive approach can significantly boost adoption rates.
- Track Feature Adoption Funnels: Identify drop-off points within the feature adoption funnel to pinpoint friction points and optimize the user experience.
- A/B Testing: Utilize A/B testing for feature rollouts to compare different onboarding experiences or variations of a feature and determine the most effective approach for driving adoption.
Pros and Cons of Tracking Feature Adoption Rate:
Pros:
- Identifies your most valuable product features.
- Guides feature development and sunsetting decisions.
- Helps optimize user onboarding flows.
- Enables targeted feature education campaigns.
- Supports pricing and packaging decisions by identifying premium features.
Cons:
- High adoption doesn't always equate to high value. Users might adopt a feature frequently but not find it essential.
- Focusing solely on adoption can encourage feature complexity over simplicity.
- Adoption data can be misleading without context around the quality of usage.
- Requires sophisticated tracking implementation and ongoing maintenance.
- Different user segments will have varying adoption patterns, requiring nuanced interpretation of the data.
When and Why to Use This Approach:
Feature adoption rate is an essential metric for any product-led growth company, particularly during the early stages of product development and beyond. It's particularly valuable for:
- Validating Product Hypotheses: Measure whether new features are resonating with users and achieving their intended purpose.
- Prioritizing Product Roadmap: Focus development efforts on features that drive the most value and engagement.
- Improving User Onboarding: Identify areas where users are struggling to adopt key features and optimize the onboarding experience accordingly.
- Driving Feature Discovery: Highlight underutilized features that offer significant value to users.
By diligently tracking and analyzing feature adoption rate, SaaS founders and product teams can gain a deep understanding of user behavior, prioritize development efforts effectively, and ultimately drive sustainable product-led growth.
7. Product Virality Coefficient (K-factor)
The Product Virality Coefficient (K-factor) is a crucial product-led growth metric that quantifies the number of new users each existing user brings to your product organically. This organic acquisition can occur through various channels, including referrals, sharing features, or other viral mechanisms embedded within the product itself. A K-factor greater than 1.0 signifies viral growth, where each existing user brings in more than one new user, creating a self-sustaining growth engine that's fundamental to successful product-led growth strategies. This compounding effect significantly reduces the reliance on expensive paid acquisition channels and allows resources to be focused on product improvement and user experience.

The K-factor isn't just a vanity metric; it provides valuable insights into your product's virality and potential for organic growth. By tracking invitation and sharing behavior within the product, you can calculate the effectiveness of your viral loops and pinpoint areas for optimization. Monitoring the viral cycle time—the time it takes for one user to bring in another—and conversion rates at each stage of the user journey allows for data-driven decisions to enhance the viral engine. This granular analysis helps product teams understand how users interact with sharing features and what motivates them to invite others.
This metric deserves its place in the list of essential product-led growth metrics because it directly reflects the inherent shareability and desirability of your product. A high K-factor often correlates with strong product-market fit and high user satisfaction, indicating that users find enough value in the product to recommend it to their networks. This organic growth loop, fueled by user enthusiasm, is far more sustainable and cost-effective than relying solely on paid marketing campaigns.
Several successful companies have leveraged the power of virality. Dropbox’s referral program, while not achieving a K-factor above 1, still contributed significantly to their early growth, reaching a K-factor between 0.35 and 0.40. Zoom experienced explosive viral growth during the pandemic as meeting links were readily shared, demonstrating the power of inherent virality. Loom, a screen recording tool, similarly benefited from the ease of sharing recordings, fueling its user acquisition. Calendly's streamlined meeting scheduling creates natural viral loops as invitees experience the product's value firsthand, often leading them to adopt it for their own scheduling needs.
While the benefits of a high K-factor are compelling, it's crucial to understand the challenges involved. Achieving and maintaining a K-factor above 1.0 is notoriously difficult. Virality can be influenced by seasonal trends or external factors beyond your control. Overemphasizing viral mechanics can sometimes detract from the core user experience, creating a delicate balancing act. Additionally, the quality of referred users can vary, and not all referrals will translate into engaged, long-term users.
For early-stage startups, self-serve SaaS companies, and indie hackers pursuing a product-led growth strategy, understanding and optimizing the K-factor is paramount. Here are actionable tips to boost your product's virality:
- Integrate sharing seamlessly: Build sharing features directly into core product workflows, making them an integral part of the user experience rather than an afterthought.
- Incentivize participation: Offer rewards to both the referrer and the referee to encourage active participation in the referral program.
- Minimize friction: Streamline the invitation and signup processes to remove any barriers that could discourage new users.
- Continuous optimization: Track and analyze each step of the viral funnel to identify areas for improvement and optimize conversion rates.
- Focus on value: The most effective way to drive virality is to create a product that provides inherent value and encourages users to share it with their networks.
Learn more about Product Virality Coefficient (K-factor) for deeper insights into referral marketing techniques that can help you boost your K-factor. By focusing on building a truly valuable and shareable product, you can harness the power of virality and unlock sustainable, organic growth for your business. Remember, the key to a successful product-led growth strategy lies in creating a product that users love and are eager to share.
Product-Led Growth Metrics Comparison
| Metric | Implementation Complexity 🔄 | Resource Requirements ⚡ | Expected Outcomes 📊 | Ideal Use Cases 💡 | Key Advantages ⭐ |
|---|---|---|---|---|---|
| Product Qualified Leads (PQLs) | High - requires advanced product analytics | Medium-High - analytics tools & integration | Increased conversion rates, shorter sales cycle | B2B SaaS, product-led sales with product usage data | Higher conversion, sales-marketing alignment |
| Time to Value (TTV) | Medium - defining value moments can be tricky | Medium - user journey tracking tools | Reduced churn, improved activation & retention | User onboarding optimization, early user engagement | Faster user activation, reduced churn |
| Product Adoption Rate | Medium - feature usage tracking & segmentation | Medium - cohort and behavior analytics | Insight into feature success & product-market fit | Feature prioritization, product-market fit analysis | Identifies feature success & user engagement |
| Net Promoter Score (NPS) | Low - simple surveys, easy to implement | Low - survey tools & feedback collection | Measures customer loyalty & referral likelihood | Customer satisfaction, brand loyalty tracking | Easy to benchmark, predicts organic growth |
| DAU/MAU Ratio | Low-Medium - user activity tracking | Low-Medium - usage data platforms | Indicates product stickiness and engagement | Engagement monitoring, retention tracking | Clear engagement signal, usage trend insights |
| Feature Adoption Rate | Medium-High - detailed feature usage tracking | Medium-High - analytics and tracking setup | Guides product roadmap and onboarding improvements | Feature prioritization and user onboarding | Identifies valuable features, targeted education |
| Product Virality Coefficient | Medium - tracking referrals and viral loops | Medium - tracking invites and conversions | Organic, sustainable user growth | Referral programs, viral product growth strategies | Low-cost growth, compounding user acquisition |
Fueling Your Product-Led Growth Journey
Mastering product-led growth hinges on understanding user behavior and committing to continuous optimization. By meticulously tracking and analyzing key product led growth metrics like Product Qualified Leads (PQLs), Time to Value (TTV), Product Adoption Rate, Net Promoter Score (NPS), Daily/Monthly Active Users (DAU/MAU), Feature Adoption Rate, and the Product Virality Coefficient (K-factor), you gain invaluable insights into what your users need, prefer, and find challenging. This data empowers you to make informed product development decisions, streamline onboarding processes, personalize the user experience, and ultimately drive sustainable growth. Optimizing your development pipeline involves not just choosing the right metrics but also understanding how they interact and influence your overall goals. For a deeper dive into the strategic use of CI/CD metrics, explore this comprehensive guide.
The most crucial takeaway is this: these metrics aren’t just numbers; they’re a roadmap to understanding your users and building a product they love. As you become more adept at interpreting and acting upon these insights, you'll be better positioned to navigate the complexities of the SaaS market. In the competitive landscape of 2025 and beyond, leveraging the power of product led growth metrics is no longer a luxury—it's a necessity.
Ready to supercharge your product-led growth and turn your satisfied users into passionate advocates? Refgrow seamlessly integrates affiliate programs directly into your product, amplifying your PLG efforts and driving organic growth. Explore the power of integrated affiliate marketing with Refgrow today.